If you’ve ever bought an option hoping for a big move, got the move you wanted, and still lost money, welcome to the club. You likely fell victim to the hidden dimension of the options market: volatility.
Most beginner investors focus only on price direction, but professionals focus on volatility (the market's "fear premium"), the factor that often decides the real winners and losers. Understanding implied volatility (IV) as a forecast, and analyzing how it shifts with strike prices (skew) and time (term structure), can help you learn when to buy cheap options or sell expensive ones.
What is volatility skew?
To understand skew, we have to start with a little history. Theoretical pricing models, like the famous Black-Scholes model, rely on a very neat and tidy assumption that volatility is flat.
In this theoretical world, the market expects the probability of a stock going up 10% to be roughly the same as it dropping 10%.
But in reality, the market isn’t so neat. It’s messy, emotional, and prone to panic. But most importantly, supply and demand shows that some strikes are riskier or more desirable than others, creating a curve.
The volatility smile vs. the smirk
In the real world, investors are generally terrified of a crash. The thought of waking up to a portfolio that has been cut in half is enough to fill anyone with dread.
What they’re less terrified of is missing out on a rally.
Because of this deep-seated human fear of loss, demand for "crash protection" (specifically out-of-the-money (OTM) puts) is usually much higher than demand for upside speculation or OTM calls.
This supply and demand imbalance creates a volatility skew, often looking like a "smirk" on a chart.
The smirk
This is the general rule for stocks in particular. When it comes to options, OTM puts trade at a much higher implied volatility (IV) than OTM calls.
One way to think of it is like insurance. You pay a premium to insure your house against a fire, which is like buying puts as part of an options strategy. You generally don't pay high premiums to insure against your house suddenly doubling in value, which would be buying calls. The market charges a premium for fear.
Larger forces at play
It isn't only retail traders like you buying puts that cause the smirk; it’s the massive gravitational pull of institutional investors.
Institutions like pension funds, endowments, and mutual funds hold trillions of dollars in long equity positions. By mandate, many of these funds are required to hedge their portfolios.
They’re "forced buyers" of OTM puts. Because they own the stock, they don't need calls. They already profit if the market goes up. But they do need downside protection.
This structural, relentless demand for OTM puts keeps the left side of the volatility curve consistently elevated.
So when you trade skew, you are effectively trading against the hedging needs of some of the world's largest institutions.
The smile
While stocks smirk, currencies often smile. That might sound like the world’s most confusing fortune cookie, but it actually refers to the symmetrical nature of uncertainty in forex markets. A currency pair might explode up or collapse down with equal probability. In this case, both OTM puts and calls have high IV, creating a U-shaped "smile."
Know what to look for
Before getting into term structure, it’s essential to know how to put “the Greeks” to work — especially vega.
If delta measures how much an option's price changes when the stock moves, vega measures how much the price changes when volatility moves. Essentially, it measures sensitivity to fear.
Vega represents the cash amount an option's price will change for every one percentage point change in IV (or “vol point”). This can be critical in strategy selection.
High vega suggests an option is super sensitive to market mood swings. Long-term options (LEAPS) generally have the highest vega.
Short-dated options have lower vega but higher gamma, making them more responsive to price moves than volatility shifts.
Understanding options term structure
If skew is how volatility changes across price, term structure is how it changes across time.
Implied volatility isn't a single number. It's a collection of forecasts for different expiration dates.
Visualizing these forecasts side-by-side gives you the term structure, and it usually takes one of two shapes:
1. Contango (normal market)
In a healthy market, the near future is somewhat predictable. We know roughly what a stock price will do tomorrow. But three months from now? Who knows!
Short-term IV is low, and long-term IV is higher, making for a generally calm vibe.
2. Backwardation (inverted market)
When a crisis hits, or a major event like an important earnings report approaches, nobody cares about what will happen in six months; they’re terrified of what’ll happen in the next six hours
This is "panic mode." Near-term IV spikes violently, while long-term IV stays relatively stable.
When the curve inverts, short-term options become very expensive. This is often a signal for professionals to sell short-term premiums rather than buy them.
Put it in a chart: the volatility surface
How do you feel about charts? If you like them as much as we do (which is a lot), it’s time to put it all together.
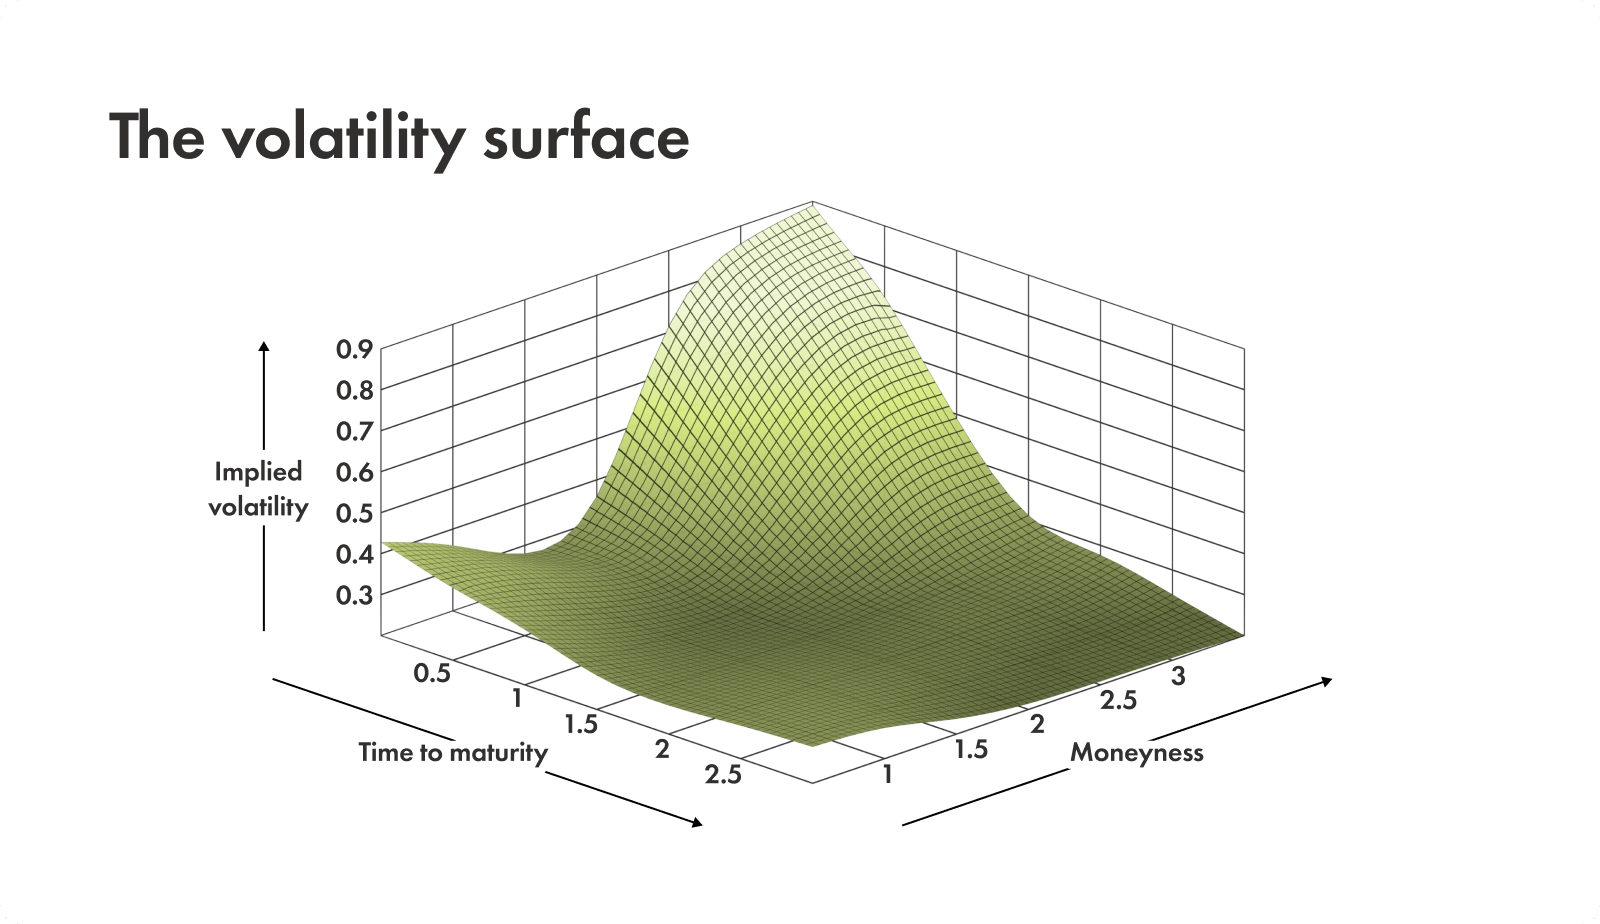
Now that we know the structures, by combining skew (X-axis: strike price) and term structure (Y-axis: time), you can get a three-dimensional chart known as the volatility surface.
Imagine a mountain terrain:
"Smirk" creates a slope where the lower strikes are higher up the mountain.
"Term structure" creates a slope where distant expiration dates are higher or lower.
Professional traders don't just look at a single number; they look at this entire terrain. The goal is to spot a bump or sinkhole on the surface.
That points out a specific strike and expiration date where options are mispriced in relation to the surrounding terrain.
The mechanics of IV crush
This is the classic "rookie killer."
IV crush example
Let’s say a company is about to report earnings. Everyone knows the stock will move, so IV skyrockets. Because of this, option prices balloon, packed with this "fear premium."
Then the earnings report comes out, and the stock moves up 5%.
Uncertainty instantly transforms into certainty. The event is over. The fear evaporates. IV collapses. It’s common for IV to drop 20% or 30% in minutes in situations like this.
Even though you guessed the direction right (the stock went up), the value of your call option drops because the “air" (IV) was let out of the balloon faster than the price movement could pump it back up.
Strategies to avoid and exploit IV crush
Avoid
Avoid buying calls or puts immediately before a known event. This is because you’re buying at the peak of the fear premium.
Exploit
To exploit IV crush, you need to be the one selling the insurance.
Strategies like iron condors or credit spreads allow you to sell that inflated premium.
When IV crushes, the options you sold effectively lose value, which is great for you. This allows you to close the trade for a profit, even if the stock doesn't move much.
How to trade volatility skew
Understanding skew isn't just academic. It gives you a secret, helpful shopping list of what’s expensive and what’s cheap.
Trading steep skew: high put skew
What you see: The market is nervous. Puts are trading at a massive premium compared to calls.
Your next move:
Strategy 1 → Bull put spreads
Instead of buying a call to bet on a rise, you sell an expensive OTM put and buy a cheaper, lower-strike put to define your risk. You profit from the high premium decay.
Strategy 2 → Risk reversals
If you’re bullish, you can sell that expensive OTM put to finance the purchase of a call. In this case, you’re using the market's fear to pay for the upside you think is on the way.
Trading flat or reverse skew
What you see: Calls are surprisingly expensive right now. This is rare in indices but common in meme stocks or takeover targets where investors have their hearts set on an upside explosion.
Your next move:
Strategy → Covered calls or collar spreads
If you own the stock, you could sell OTM calls here to generate significant income. This is because the “greed premium” is high, which you can take advantage of, but it will have to come with a cap to your upside.
Vertical spreads and skew
What you see: Taking into consideration skew, you’ve spotted a good opportunity to buy or sell an option. The only thing is, you’re very exposed, and you worry that if IV drops, you’ll lose.
Your next move:
Strategy → Vertical spreads
By turning a naked option into a vertical spread (buying one option and selling another), you neutralize some of the volatility risk. You are buying high vol, but also selling high vol, canceling out some of the "noise" so you can focus on the price direction.