Understanding momentum indicators
To decide which momentum indicator is right for your needs, it’s important to understand what momentum indicators measure. There are two main types to choose from: trend and momentum indicators.
Trend indicators
Like moving averages, trend indicators tell you which way the market is generally heading (up, down, or sideways). That way, you can ride the wave once a trend has started.
Momentum indicators
These indicators can act as the speedometer for the market by measuring the speed and strength of price movement. This is important because slowing momentum can suggest an upward trend is slowing down even if prices are still climbing. It can also signal the opposite: that a reversal might be on the horizon before the price chart itself makes it obvious.
What is the MACD indicator?
The moving average convergence / divergence (MACD) is a mouthful, but its job is simple: it shows you which way the market is moving and how strong that movement is. Created by Gerald Appel in the late 1970s, the indicator shows the relationship between two moving averages of a security's price — the 12-day average and the 26-day average — and it shows them coming together, crossing, and then moving apart. This helps traders identify both the direction and strength of market trends by measuring the relationship between short-term and long-term price movements.
Understanding MACD components
The MACD of an asset is made up of three parts that work together to tell a story:
MACD line - This is the fast line. It's calculated by subtracting the 26-period exponential moving average (EMA) from the 12-period EMA of an asset. Its job is to react quickly to recent price changes. When it rises, it means the short-term momentum is increasing. When it falls, the opposite is true.
Signal line - This is the slow line. It's a 9-period EMA of the MACD line. Because it's an average of the MACD line, it smooths out the signals and helps avoid getting incorrect indications from small price changes.
The histogram - This appears as a bar chart. It represents the difference between the MACD and signal line. When the MACD line is above the signal line, it’s positive (above the zero line), and when the MACD line is below the signal line, it’s negative (below the zero line), with the bars growing taller as the lines get further apart, and shrinking as the lines get closer.
MACD components at-a-glance
Component | Formula | Interpretation |
|---|---|---|
| MACD line | 12-period EMA - 26-period EMA | Shows the short-term trend's momentum. |
| Signal line | 9-period EMA of the MACD line | Acts as a trigger for buy/sell signals. Smoothes out the MACD line. |
| Histogram | MACD Line - Signal line | Visualizes the difference between the lines. |
How to interpret MACD signals
With the MACD plotted, traders look for specific points of interest that can signal where the asset’s price might be headed.
Crossovers
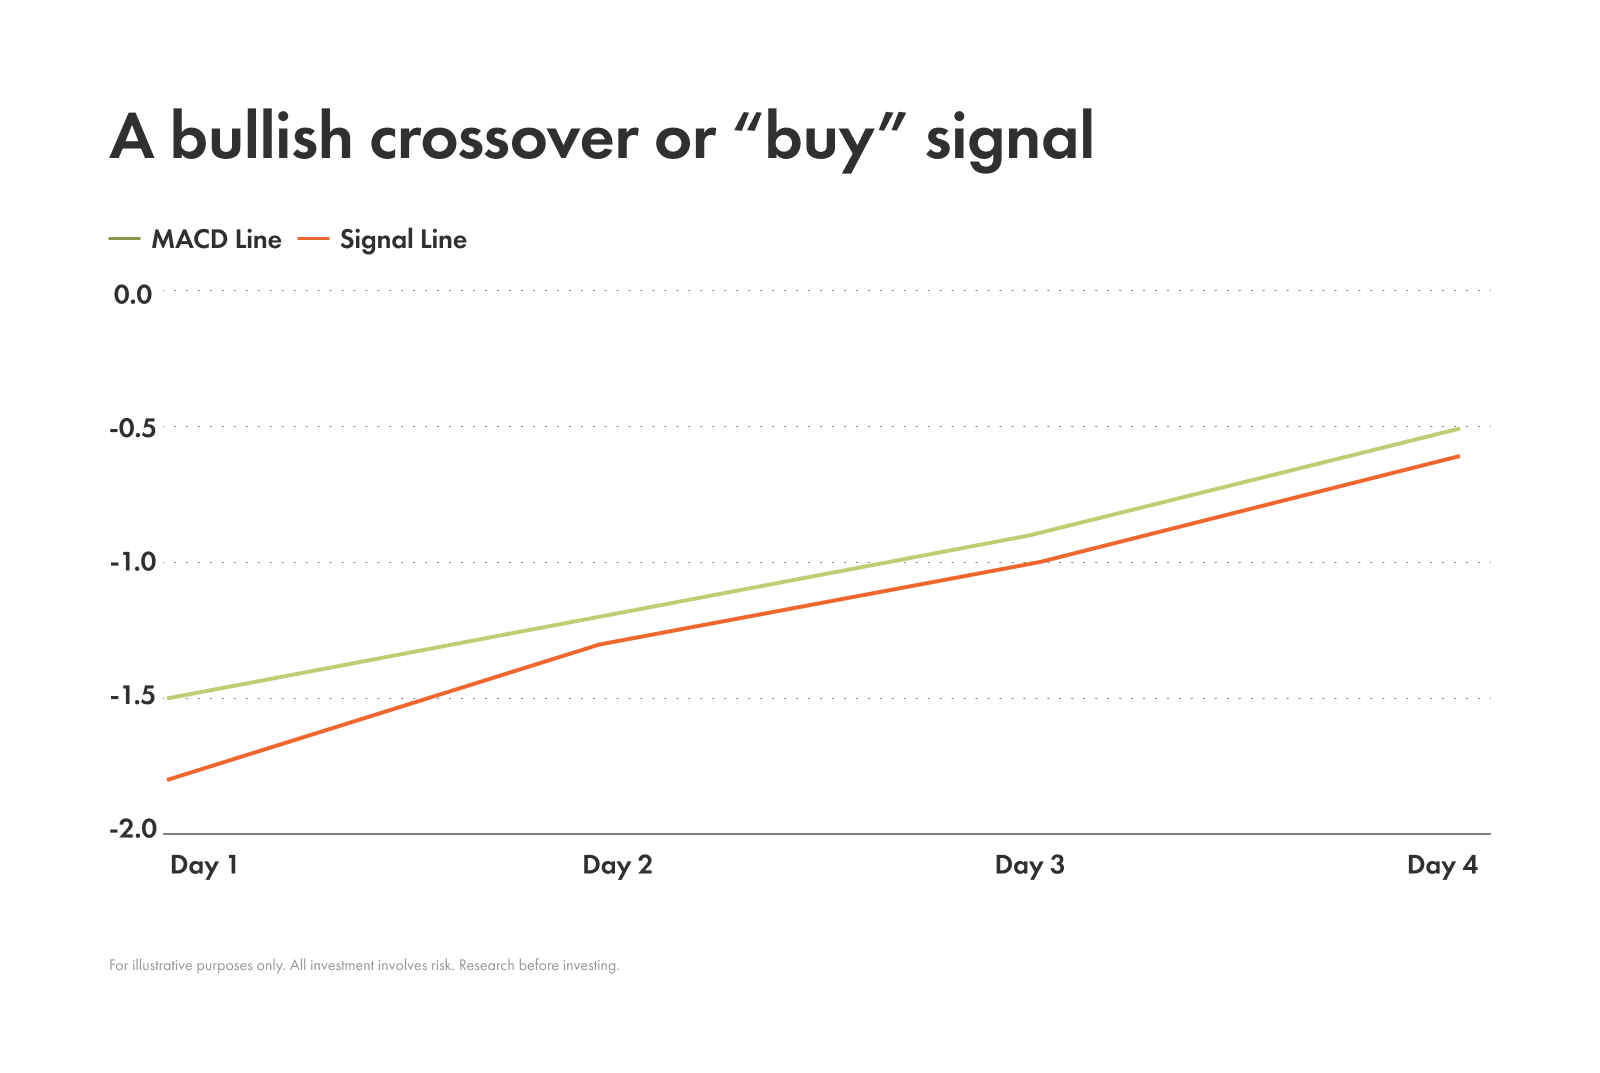
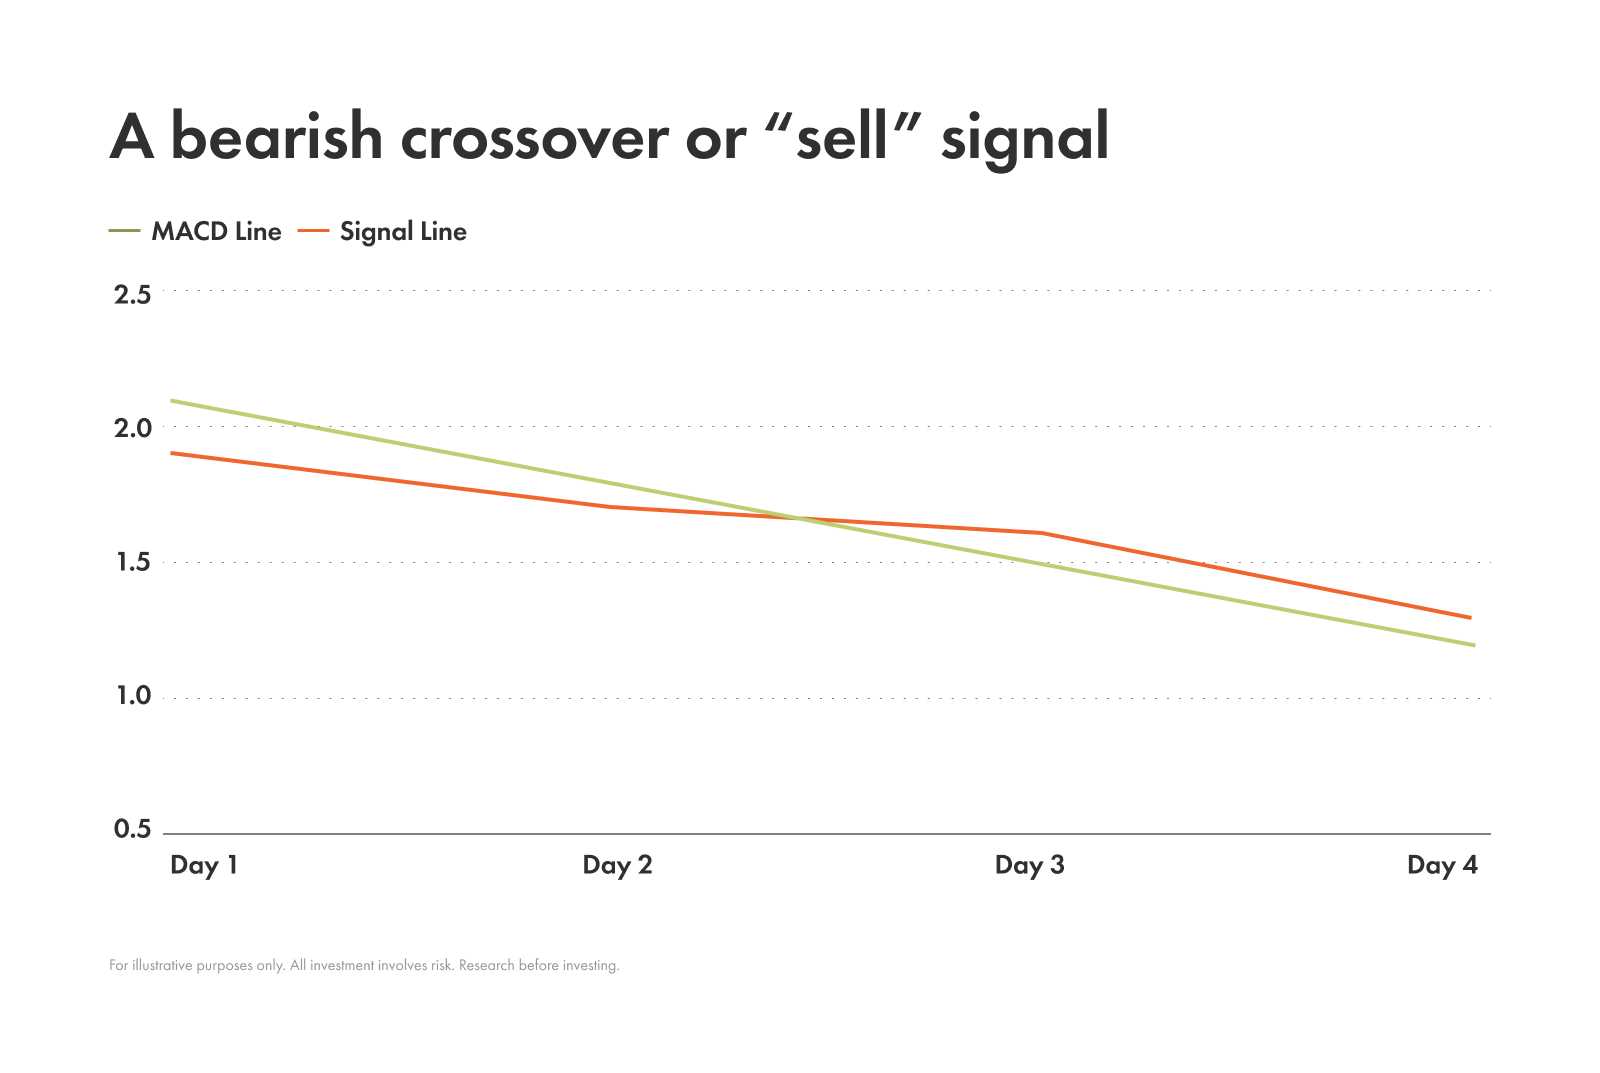
A crossover happens when the MACD line and the signal line cross each other, which can signal either bullish or bearish trends.
A bullish crossover, or “buy” signal: This happens when the MACD line crosses above the signal line, suggesting that upward momentum is picking up and potentially signaling a good time to buy.
A bearish crossover, or “sell” signal: This happens when the MACD line crosses below the signal line, suggesting that downward momentum is increasing and potentially signaling a good time to sell.
Divergence
Divergence happens when the MACD and the price of the asset are telling two different stories. It can signal that the current trend is weakening and a reversal might be coming, or it can signal bullish sentiment.
Bullish divergence: When an asset’s price makes a lower low, but the MACD makes a higher low you’ve spotted a bullish divergence. This is a subtle warning that the downward momentum is fading, and a reversal to the upside could be near.
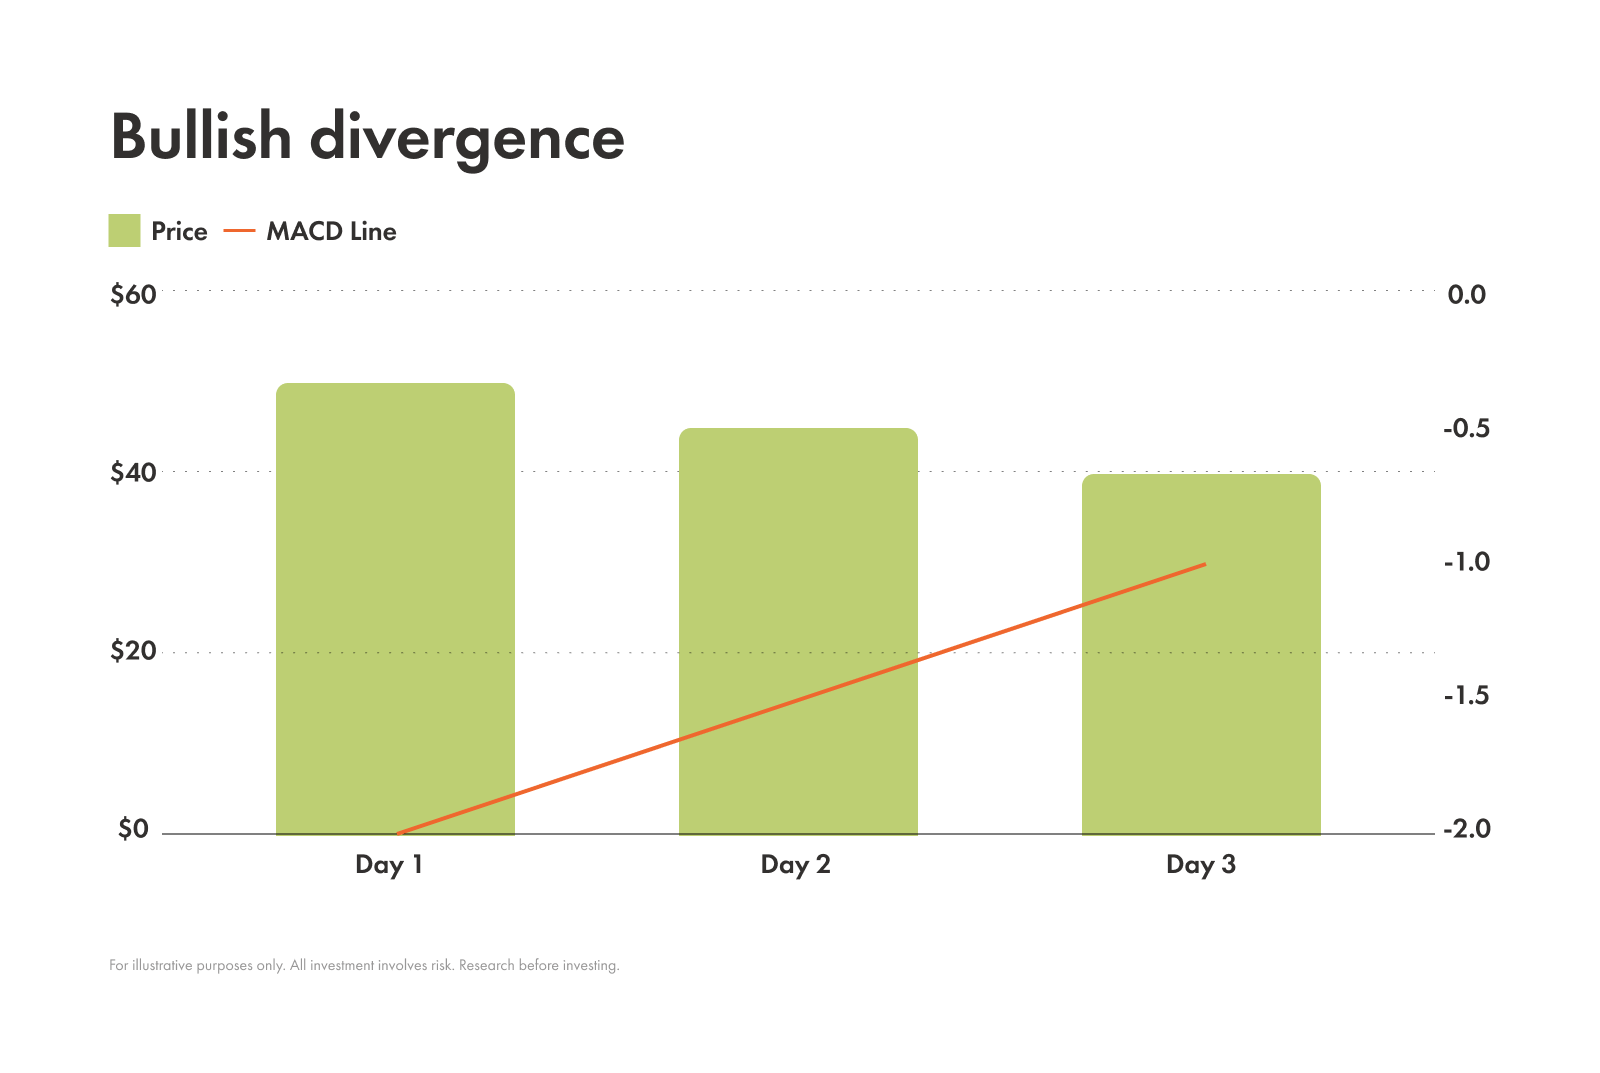
Reading: Price is making new lows, MACD is making higher lows. Downward momentum could be fading.
Bearish divergence: When an asset’s price makes a higher high, but the MACD makes a lower high you’ve spotted a bearish divergence. This can be a signal that the upward momentum is beginning to slow down, and the price might be ready to drop.
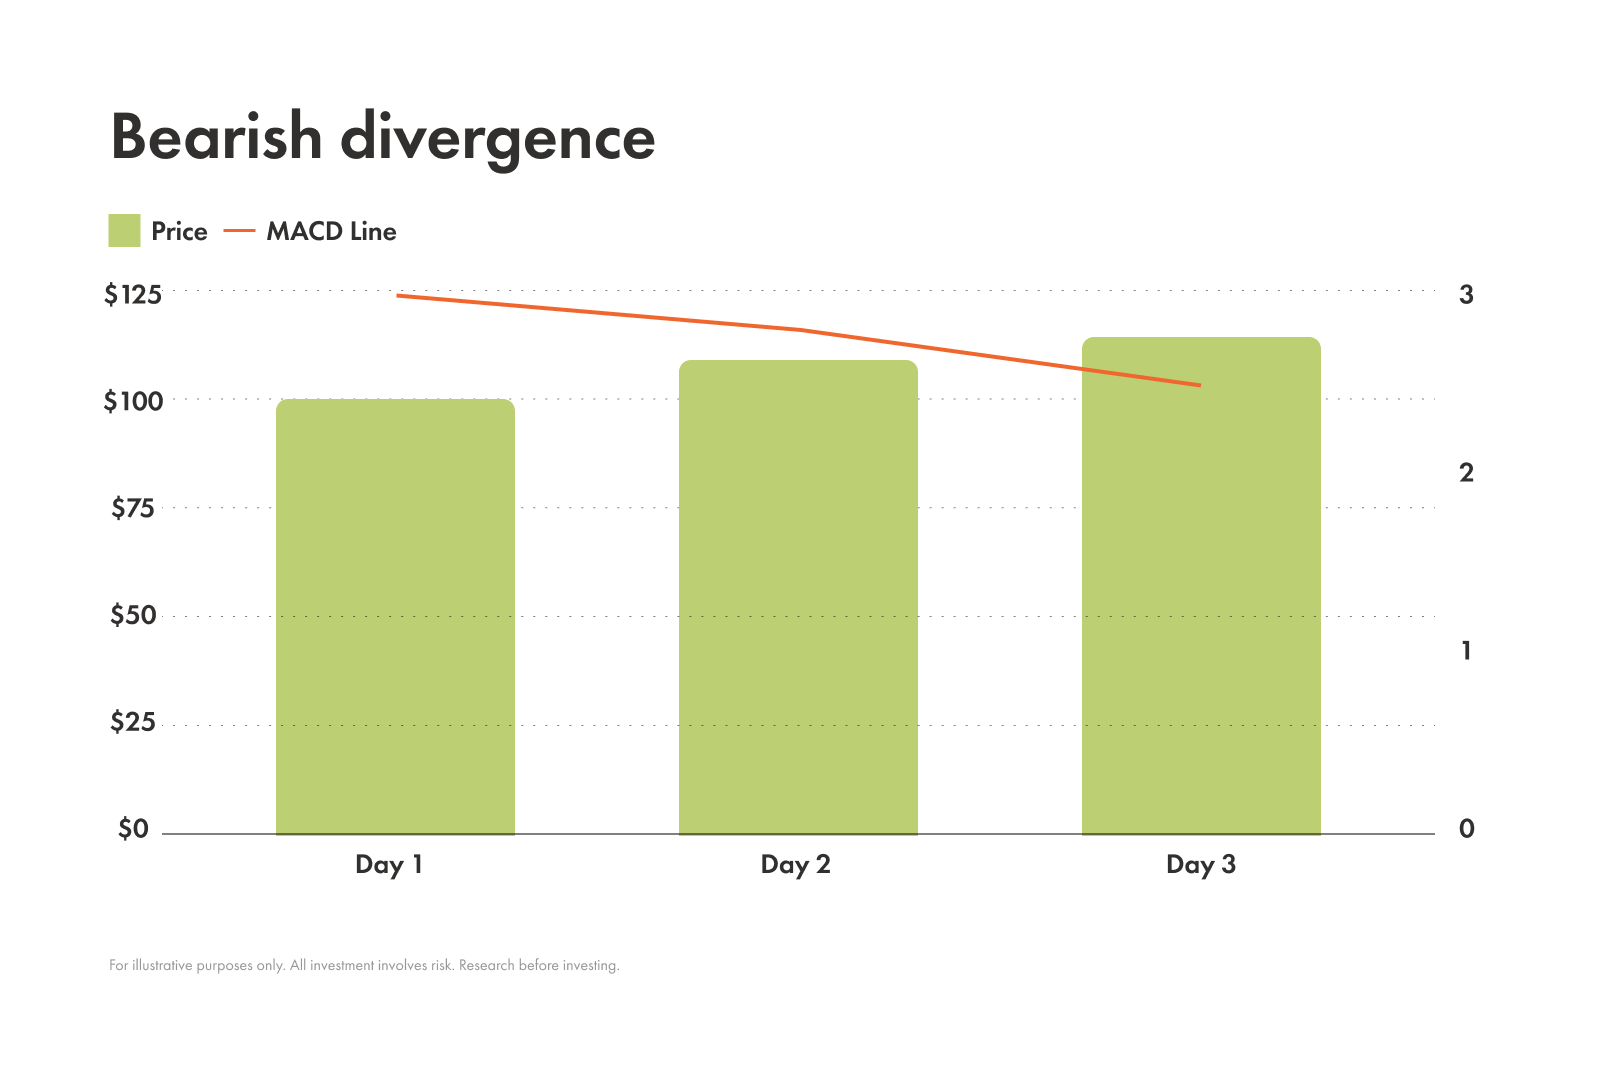
Reading: Price is making new highs, MACD is making lower lows. Upward momentum could be fading.
Zero line crossovers
The zero line is an important mark on the MACD chart. It shows the point where the 12-period EMA and the 26-period EMA are equal. Just like with crossovers and divergence, there are both bullish and bearish versions of zero line crossovers.
Bullish zero line crossover: This appears when the MACD line crosses above the zero line, the classic sign of an uptrend.
Bearish zero line crossover: This appears when the MACD line crosses below the zero line, another classic signal of a downtrend.
What is the RSI?
If the MACD is a trend-following indicator, the relative strength index (RSI) is its complementary momentum-following indicator cousin. Developed by J. Welles Wilder, Jr., the RSI is a momentum oscillator that measures the speed and strength of price movements.
It does this by measuring the average gain of an asset over a period of time against the average loss of that same asset over the same period, giving you a value between 0 and 100.
How to interpret RSI
Overbought and oversold conditions
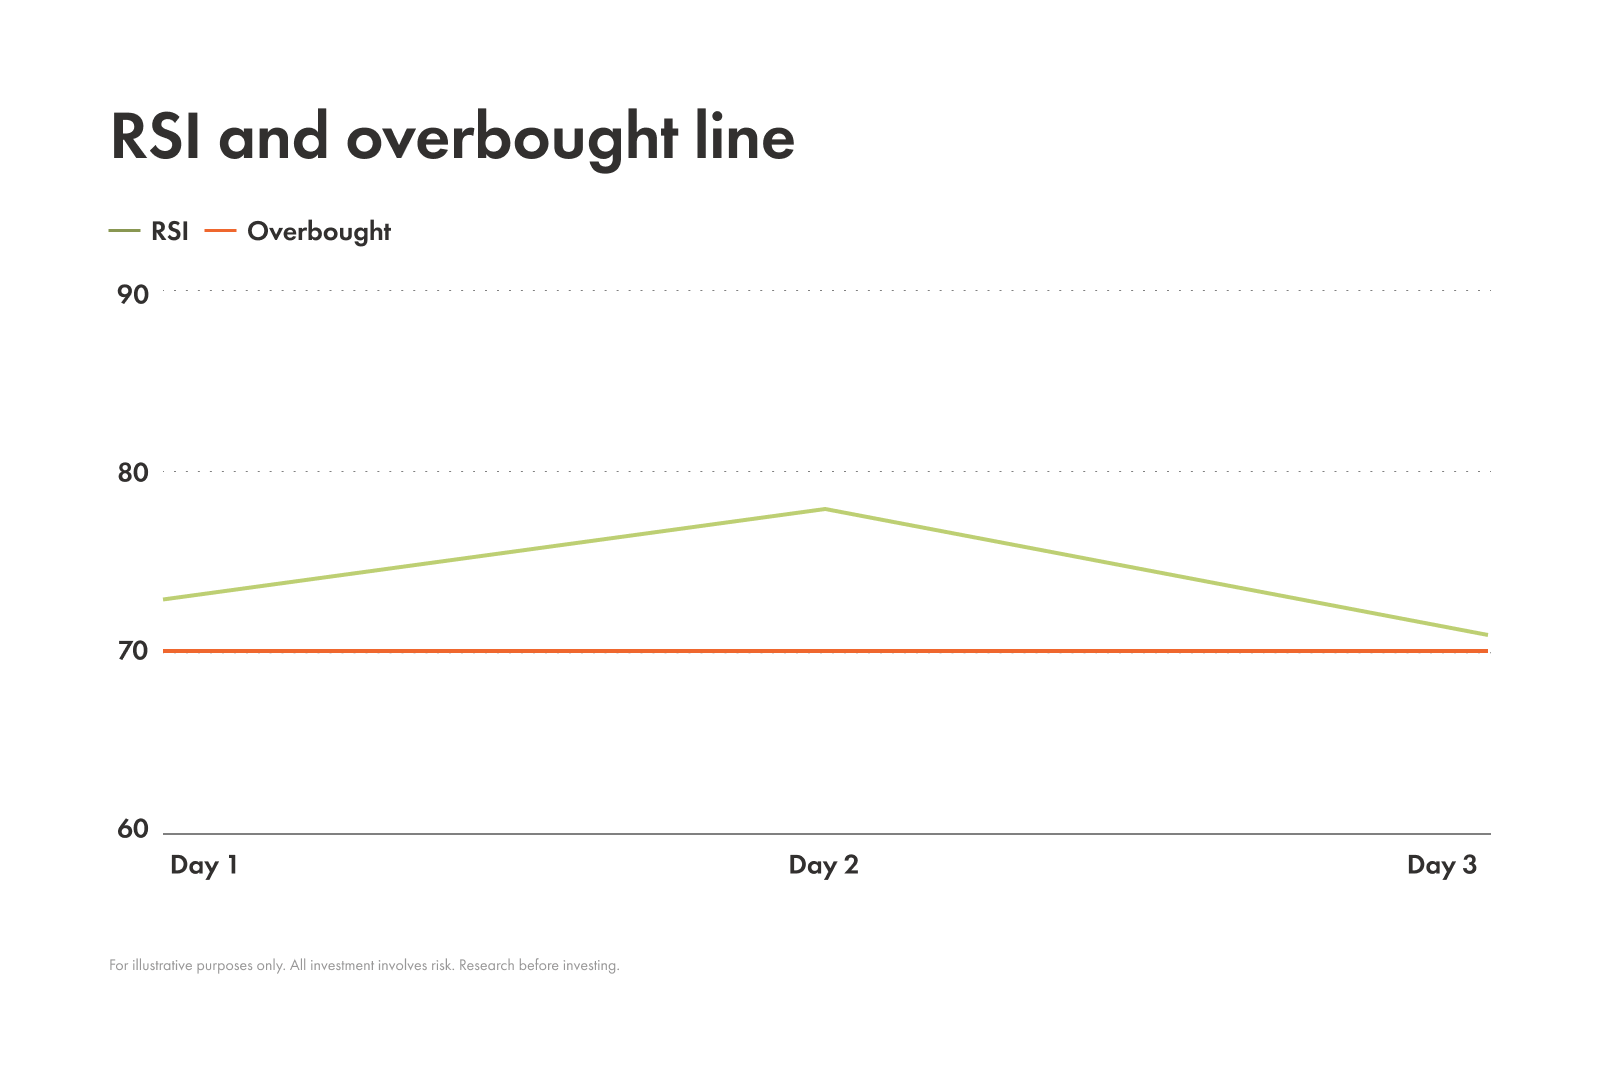
RSI is mostly used by traders to spot overbought and oversold conditions. Basically, RSI flags when an asset is getting too hot or too cold through its thresholds.
Overbought
When RSI is above 70, it suggests the asset might be overbought and could be due for a pullback or price correction.
Overold
When RSI is below 30, it suggests the asset might be oversold and could be due for a bounce.

Bullish and bearish divergence in RSI
Divergence in the RSI can provide clues for catching an upcoming trend reversal, and there are bullish and bearish versions of this indicator too.
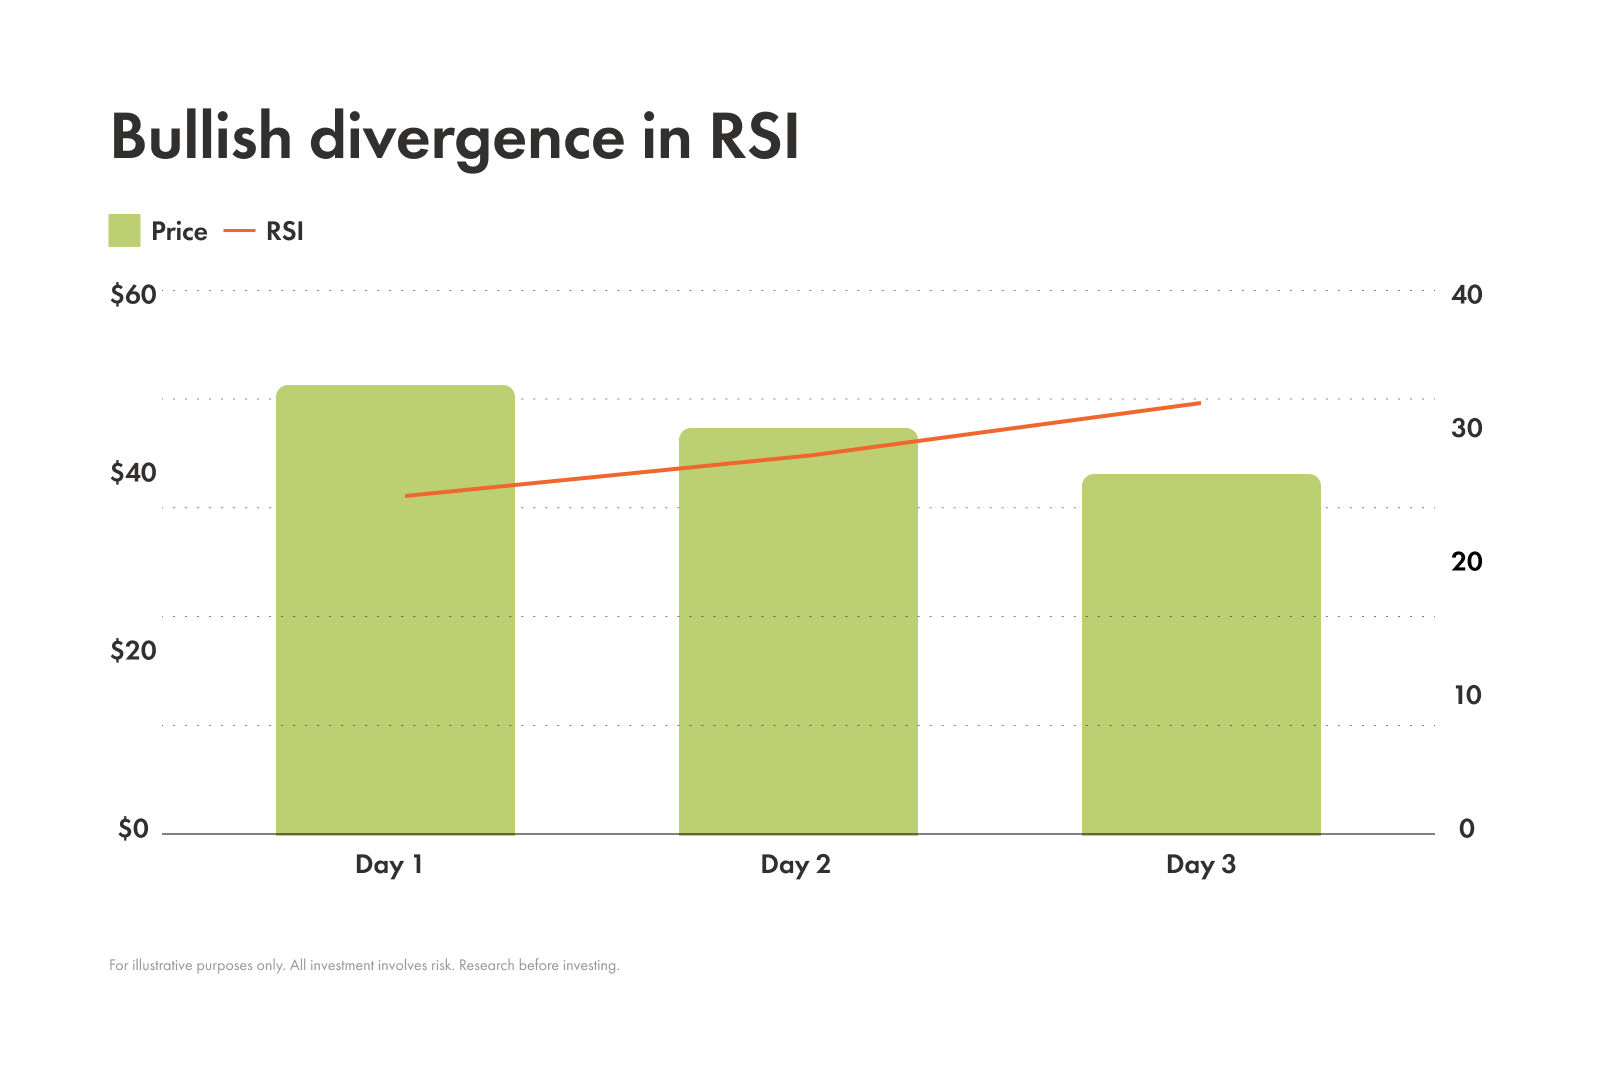
Bullish divergence
When an asset’s price makes a new low, but its RSI makes a higher low, this suggests that its downward momentum is getting weaker and a reversal could be coming soon.
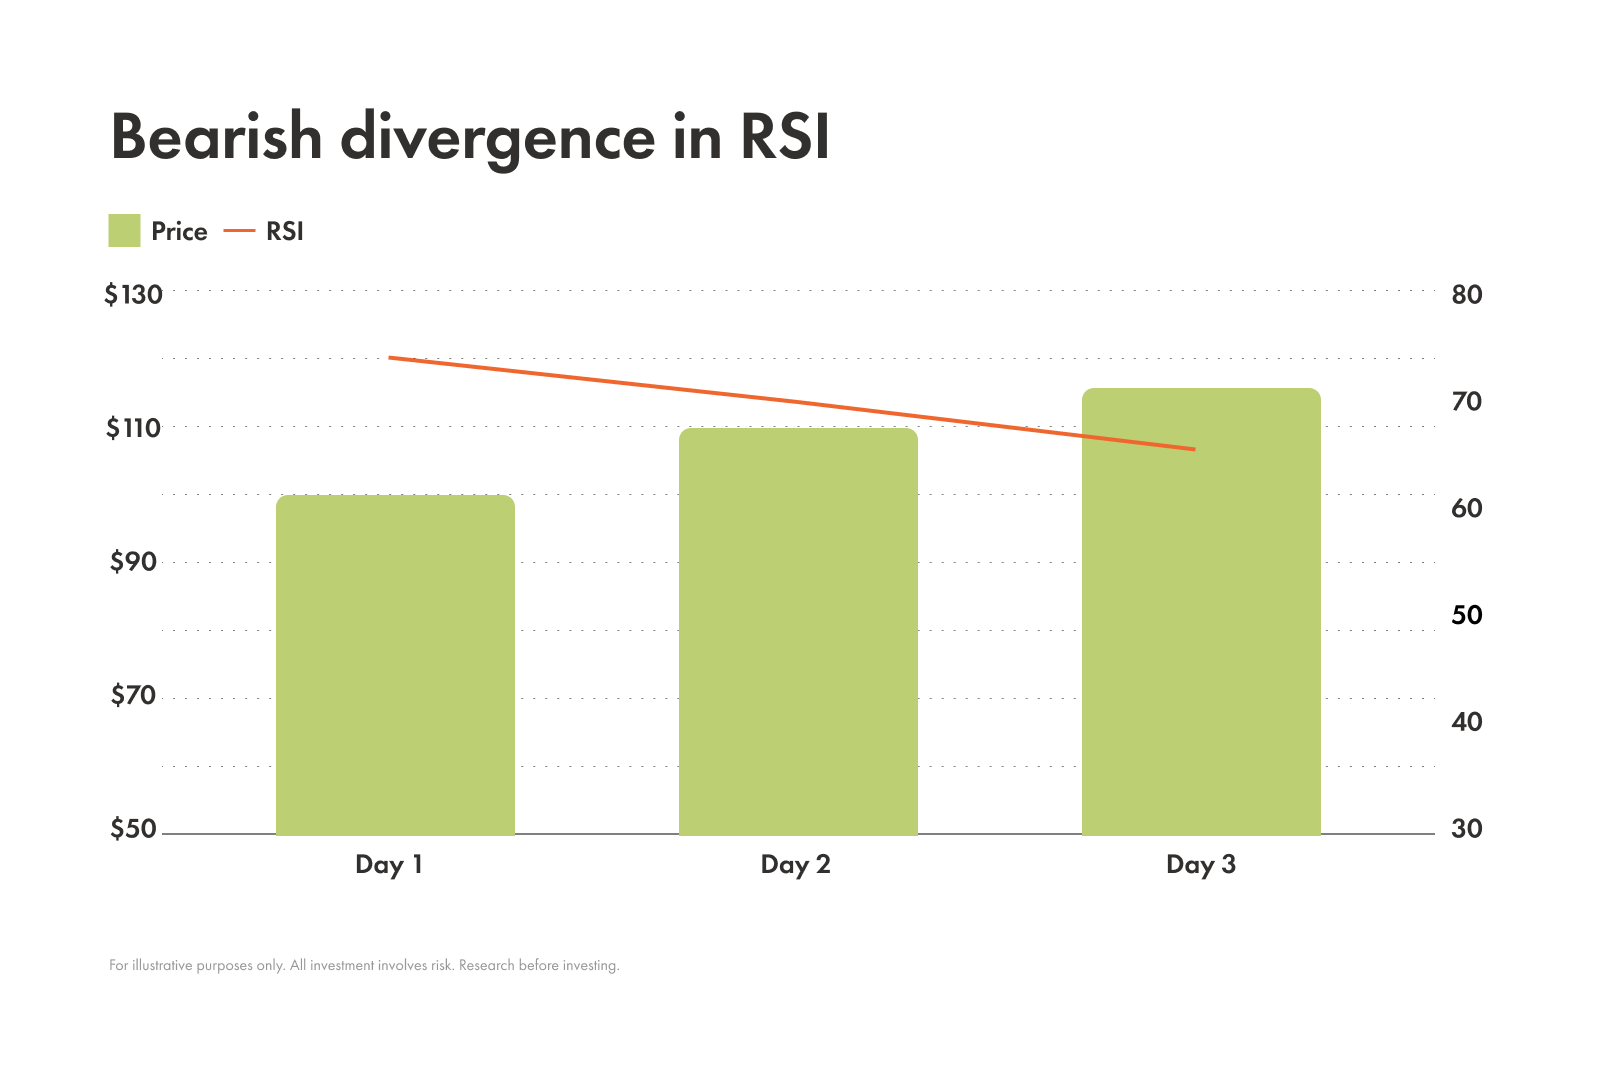
Bearish divergence
On the other hand, when an asset’s price makes a new high, but its RSI makes a lower high, that can suggest its upward momentum is fading, and a drop might be coming soon.
Adjusting RSI settings
Like other indicators, the settings of RSI can be customized. The default RSI setting is a 14-period, calculating strength based on the past 14 trading periods, but you can adjust this setting to suit your trading style.
Shorter period
Example: A 7-period RSI
A shorter period makes the RSI more sensitive and reactive to price changes. It’ll hit overbought or oversold levels more often than the standard setting, which is useful for short-term traders but can also lead to more false signals.
Longer period
Example: A 21-period RSI
A longer period makes the RSI less sensitive. It won't give as many signals, but the signals it does give are often more reliable, making it better for long-term investors.
Stochastic oscillator
While RSI measures the speed of price changes, the stochastic oscillator is a little different. It tells you where the asset’s closing price is compared to its high-low range over a specific period of time.
Developed by George Lane in the 1950s, the core idea of the stochastic oscillator is that in an uptrend, prices should be closing near their highs, and in a downtrend, they should be closing near their lows.
The general formula used is:
Where:
P = the last closing price
LowN = the lowest price over the last N periods
HighN = the highest price over the last N periods
%D = a 3-period simple moving average of %K, SMA3(%K)
%D−Slow = a 3-period SMA of %D, SMA3(%D).
%K=P-LowNHighN-LowN100
%D=%K1+%K2+%K33
There are two main versions of this indicator:
Fast stochastic
Uses the raw %K line. It's more volatile and gives signals more frequently.
Slow stochastic
Uses a 3-period simple moving average of the fast %K line. This is the smoother and more commonly used version.
Overbought and oversold levels:
The typical overbought level is 80. This means a reading above 80 suggests that the price is coming up to the maximum of its recent range.
The typical oversold level is 20. A reading below 20 suggests that the price is reaching the lower end of its recent range.
When to opt for the stochastic oscillator:
Traders often use the stochastic oscillator instead of the RSI when the market is choppy and prices are jumping back and forth because it can be more effective at identifying short-term reversals at support and resistance levels.
Using MACD and RSI together
This is where things can get really interesting. Instead of relying on one indicator, you can use them together for a more complete picture.
While the MACD can help you identify the overall trend direction and its strength, the RSI or the stochastic oscillator can help you time your entry and exit points by spotting overbought and oversold conditions within that trend.
For example, let's say you see a bullish MACD crossover (a sign of a new uptrend). You could pause before jumping in — keeping an eye out for the RSI to drop to an oversold level, suggesting a temporary pullback in the new trend. Now, let’s say the RSI has moved back just above 30 and you make an informed decision to buy using these two indicators. The long-term trend is up and you're entering at an assumed short-term low, executing trades with precision.
While MACD, RSI, and the stochastic oscillator are all powerful tools for technical analysis, there are some common pitfalls to avoid when using them.
Common mistakes to avoid
Even the best tools can be misused, and the MACD and RSI are no exception. Here are some things to steer clear of:
Taking signals without confirmation. A bullish MACD crossover might look great, but if the price action itself is still trending down, or if the RSI is not confirming the move, you might be walking into a "false signal." Always look for other clues from the chart.
Ignoring higher timeframes. A signal on a 5-minute chart might tell you one thing, but a signal on a daily chart will tell you the bigger, more important story. Taking the time to check higher timeframes and understand the overall market context before deciding to buy or sell is beneficial.
Over-optimizing indicator settings. It's easy to get lost in the weeds constantly tweaking your settings. While adjusting them can be helpful, trying to find the perfect setting for every single situation can be a major distraction. You might want to focus instead on finding what works for you and then stick with it.
Limitations of MACD and RSI
Nothing is perfect, including indicators. Knowing the limitations of these tools is important before putting them to work.
Lag in trending markets. Because both MACD and RSI are based on past price data, they’re known as lagging indicators. Because of this in a very strong, fast-moving trend, they could give reversal signals until after a large part of the move has already happened.
False signals in unclear conditions. In sideways or choppy markets where there's no clear trend, the MACD can whipsaw back and forth, giving lots of false crossovers, and the RSI can bounce between 30 and 70 without providing clear entry or exit points.
Confirmation with other tools. Relying on only one indicator isn’t a good idea. These tools work best when combined with other forms of analysis so you do need to take the time to use multiple.
Best practices for using momentum indicators
To make the most of these technical analysis tools, here are a few best practices to adopt alongside them:
Combine with other tools. When using MACD and RSI it’s typical to combine them with other technical analysis tools. For example, you can look at support and resistance levels, trendlines, and volume analysis to confirm your signals. If an RSI signal lines up with a key support level, for example, it's a much stronger signal.
Test different settings. The default 14-period RSI and 12/26/9 MACD settings are a great starting point, but they may not be perfect for every asset or every timeframe. Take the time to test different settings to see what works best for you and your investing strategy.
Conclusion
MACD and RSI are technical analysis staples for a reason. They’re key tools in a trader's toolkit, used to gauge the market's momentum and spot potential reversals before they happen.
While they can’t act like crystal balls, they do offer a way to make more informed investing decisions. By understanding what they measure, how to interpret their signals, and their limitations, you're already a step ahead. Just remember to combine these indicators with other forms of analysis and to always test your strategies before putting real money behind them.