If you've ever looked into options trading, you've probably encountered a dense, multi-column table packed with numbers and wondered what any of it meant. That table is called an option chain; the primary tool traders use to evaluate and compare options contracts. This guide breaks down each component, walks you through how to read one step by step, and shows you how to use the information to make more informed trading decisions.
What is an option chain?
An option chain is a listing of all available options contracts for a given underlying security; typically a stock or an exchange-traded fund (ETF). It displays key details about each contract, including the strike price, expiration date, premium, trading volume, and open interest, all organized in a table format.
Most option chains split the display into two sides: call options on one side and put options on the other, with the strike price column running down the centre. A call option gives its holder the right (but not the obligation) to buy the underlying security at a specified price before a specific date. A put option is the opposite — it gives the holder the right to sell the underlying security at a specified price before that date.
Think of an option chain as a menu. It shows you everything that's available, along with the prices and key details, so you can decide which contract fits your outlook and risk tolerance.
Key components of an option chain
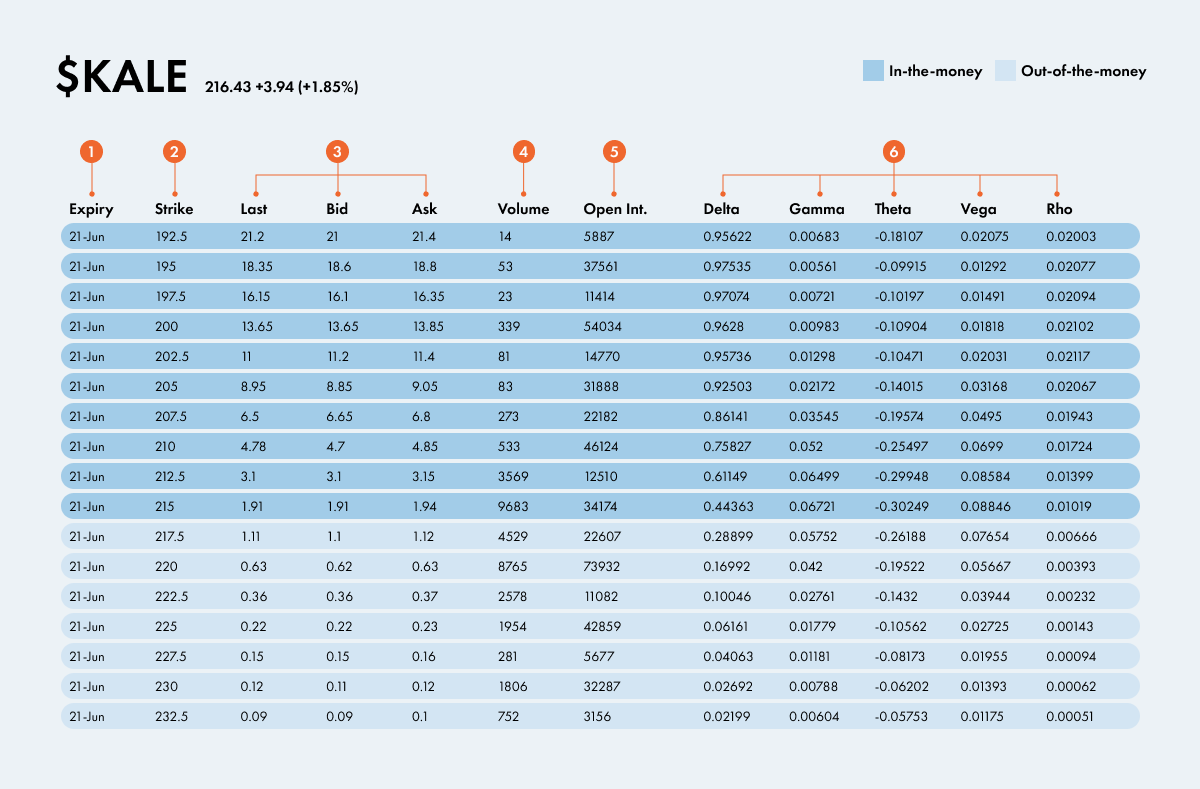
An option chain displays several columns of data for each available contract. Here are the key components you'll encounter.
Strike price
The strike price is the price at which the contract gives its holder the right to buy (for calls) or sell (for puts) the underlying security. Option chains list multiple strike prices, typically centred around the current market price of the stock. Contracts with strike prices close to the current stock price are called "at-the-money," while those further away are either "in-the-money" (ITM) or "out-of-the-money" (OTM) depending on direction.
Expiration date
The expiration date — sometimes called the maturity date — is the last date on which the option can be exercised. Option chains often group contracts by expiration, so you can compare all available strikes for a given date. Shorter-dated options tend to be cheaper but lose value faster as expiration approaches, while longer-dated options cost more but give you additional time.
Premium (bid, ask, and last price)
The premium is the cost of purchasing an option contract. An option chain typically shows three premium-related prices:
Last price — the most recent price the contract traded at.
Bid — the highest price a buyer is currently willing to pay.
Ask — the lowest price a seller is currently willing to accept.
The difference between the bid and ask is called the spread. A narrower spread generally indicates a more liquid contract, meaning it's easier to enter and exit a position at a fair price.
Volume
Volume shows the number of contracts with a specific strike price and expiration date that were traded during the previous trading day. Higher volume suggests more active trading interest and typically means better liquidity.
Open interest
Open interest is the total number of outstanding contracts with a given strike price and expiration date that have not yet been exercised, closed, or expired. It's a useful indicator of liquidity — contracts with higher open interest tend to have tighter bid-ask spreads and are easier to trade.
Implied volatility
Implied volatility (IV) reflects the market's expectation of how much the underlying security's price might move before the option expires. Higher IV typically means higher premiums, because there's a greater chance the option could end up ITM. Many option chains display IV alongside each contract, and it's particularly useful for comparing the relative cost of options across different strike prices and expirations.
The Greeks
Some option chains display the Greeks — calculations that measure how sensitive an option's price is to various factors. The most common Greeks include delta (sensitivity to price changes in the underlying), theta (time decay), gamma (rate of delta change), and vega (sensitivity to changes in implied volatility). These metrics help traders assess risk and potential reward before entering a position.
How to read an option chain step by step
Reading an option chain for the first time can feel overwhelming, but the process becomes straightforward once you know what to look for. Here's a step-by-step approach:
Choose your underlying security — start by selecting the stock or ETF you're interested in. The option chain will display all available contracts for that security.
Select an expiration date — option chains group contracts by expiration. Choose a date that aligns with your time horizon.
Identify calls and puts — most option chains display call options on one side and put options on the other, separated by the strike price column in the centre.
Review the strike prices — look at the range of available strikes. Strikes near the current stock price are at-the-money, those below (for calls) are ITM, and those above are OTM.
Compare premiums — check the bid and ask prices for the contracts you're considering. The bid-ask spread gives you a sense of liquidity.
Check volume and open interest — higher numbers in both columns suggest an actively traded contract with better liquidity.
Review implied volatility and the Greeks — if your option chain displays these, use them to gauge risk and potential price sensitivity.
In-the-money vs. out-of-the-money options
Option chains often use colour coding to show which available contracts are currently ITM or OTM. Understanding the difference is essential for evaluating any contract on the chain.
A call contract is ITM if its strike price is lower than the underlying stock's current market price. That means you'd make money if you exercised the option by purchasing the security at the strike price, then selling it for a higher price on the open market.
A put contract is ITM if its strike price is higher than the underlying stock's current market price. If you exercised your option, you'd profit by buying the stock on the open market, then selling it at the higher strike price.
A call contract is OTM if its strike price is higher than the current stock price.
A put contract is OTM if its strike price is lower than the current stock price.
One important thing to note: calculations of whether an options contract is ITM or OTM do not take the premium price into consideration. You could hold an ITM option and still lose money on the trade if the premium you paid exceeds the intrinsic value.
Option chain example
Let's say you're looking at the option chain for a Canadian bank stock trading at $95 per share. You want to understand what the chain is telling you.
You filter the chain to show contracts expiring in 30 days. On the call side, you notice a $90 strike call with a bid of $6.20 and an ask of $6.50. This contract is ITM because the strike price ($90) is below the current market price ($95). Its premium is higher because it already has intrinsic value — the $5 difference between the strike price and the stock price.
On the same expiration, a $100 strike call shows a bid of $1.10 and an ask of $1.30. This contract is OTM — the stock would need to rise above $100 before expiration for it to have intrinsic value. Its lower premium reflects that uncertainty.
Now compare the two. If you bought the $90 call at the ask price of $6.50, you'd need the stock to reach at least $96.50 by expiration to break even ($90 strike + $6.50 premium). If you bought the $100 call at $1.30, your break-even would be $101.30. The cheaper option requires a bigger price move to become profitable, but your maximum loss is limited to the $1.30 premium.
You also notice the $90 strike call has a volume of 1,200 and open interest of 8,500, while the $100 strike call shows volume of 350 and open interest of 2,100. The higher numbers on the $90 call tell you it's more actively traded and likely has better liquidity — meaning tighter spreads and easier entry and exit.
Without consulting the option chain, you might pick the $100 call simply because it's cheaper — without realising it has lower volume, wider spreads, and a much higher break-even price. The chain gives you the structured data to compare contracts side by side and make a more informed choice.
How to use an option chain for trading decisions
An option chain isn't a reference table you glance at once — it's a tool for comparing contracts and identifying opportunities that match your outlook. Here are some ways traders use the information.
Assessing direction — if you expect a stock to rise, you might look at call options. If you expect it to fall, you might look at puts. The option chain lets you compare premiums across different strike prices to find a contract that matches your outlook and budget.
Evaluating liquidity — before entering a trade, check the volume and open interest for the specific contract. Low liquidity can make it difficult to exit a position at a fair price.
Comparing risk and reward — ITM options cost more but have a higher probability of finishing with value. OTM options are cheaper but riskier. The option chain lets you see these trade-offs side by side.
Gauging market expectations — implied volatility across different strikes and expirations can reveal how much movement the market expects. Unusually high IV might signal an upcoming event like an earnings announcement.
Common mistakes when reading an option chain
Option chains pack a lot of information into a small space, and it's easy to misread them — especially when you're starting out. Here are some common pitfalls to watch for.
Ignoring the bid-ask spread — a contract might show a tempting last price, but if the current bid-ask spread is wide, you may not be able to buy or sell at a price close to that. Always check both the bid and ask before committing.
Confusing volume with open interest — volume resets daily and shows recent trading activity, while open interest reflects the total number of outstanding contracts. A contract with high volume but low open interest may not sustain its liquidity over time.
Overlooking expiration date effects — options lose value as they approach expiration (a phenomenon called time decay). A contract that looks affordable might lose most of its value quickly if expiration is days away.
Focusing only on premium cost — a cheap option isn't always a good deal. Very low premiums often mean the market considers it unlikely the contract will finish ITM. Consider the probability of profit, not the sticker price alone.
Forgetting that premiums don't factor into ITM/OTM status — a contract can be technically ITM and still result in a loss if the premium you paid is higher than the intrinsic value. Always calculate your break-even price.
Who should use option chains
Option chains are relevant to anyone trading or considering trading options — but they're not equally useful at every experience level.
If you're comfortable with how stocks and ETFs work and you're ready to explore strategies beyond buy-and-hold, learning to read an option chain is a natural next step. It's the primary tool for comparing contracts and understanding what the market is pricing in.
If you're brand new to investing, option chains might feel like information overload. Options carry risks that stocks don't — including the possibility of losing your entire premium — so it's worth building a foundation in basic investing concepts first. Understanding how stock prices move, what drives market sentiment, and how to evaluate risk will make option chains far more useful when you do start reading them.
It's also worth knowing that options trading isn't available to everyone by default. In Canada, brokerages typically require a separate options approval process that includes a knowledge questionnaire and an assessment of your trading experience. Options are classified as higher-risk instruments, and regulators want to make sure you understand the risks before you start trading them. A common misconception is that an option chain tells you what to trade — it doesn't. It shows you what's available and at what price, but the decision is entirely yours.
Reading an option chain is a skill, not a strategy. Knowing how to interpret the data doesn't tell you which trade to make — that requires a broader understanding of market conditions, risk tolerance, and your own financial goals.
The bottom line
An option chain gives you a structured view of every available contract for a given security — strike prices, premiums, volume, open interest, and more — all in one place. Learning to read one is the first step toward making more informed decisions about options trading.
The most important thing to remember: an option chain is an information tool, not a recommendation. It shows you what's available and what the market is pricing in, but it doesn't tell you what to do. Take time to understand each column, practice reading chains without placing trades, and build confidence before putting capital at risk.