Two common types of moving averages (MAs) are the simple moving average and the exponential moving average. The former gives you a basic record of average price; the latter puts more weight behind recent prices. More on that in a moment, though!
Moving averages in action
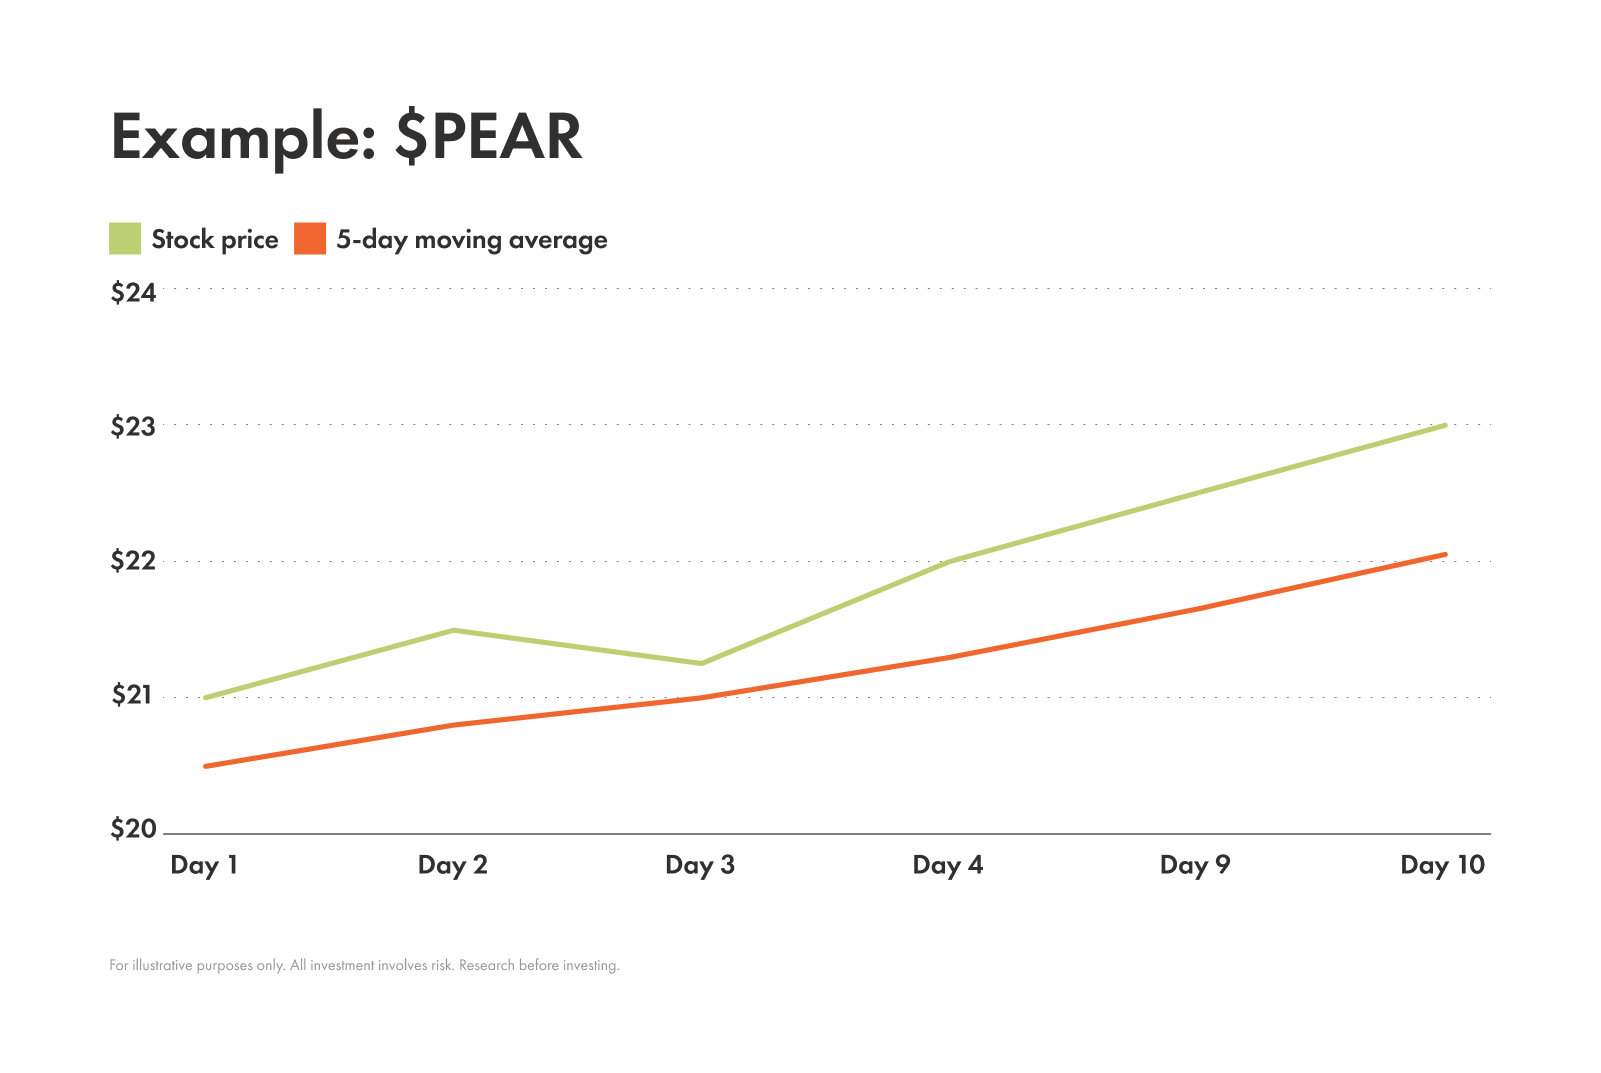
Here’s a quick example of how moving averages work: suppose you’re charting the 50-day MA of an imaginary stock called PEAR, using its daily closing prices. Each day, you add the latest closing price to your calculation and remove the oldest one, creating a new average. Plotting these averages on the chart and connecting them with a line gives you the moving average, which smooths out daily price swings and helps reveal the stock’s overall trend.
Once you know the MA of a stock, you should have a simple, clean line that shows the upward or downward trend of a stock.
Easy enough, right? Now let’s dig in a little deeper.
Simple moving average vs. exponential moving average
As we said up top, two of the most popular types of moving averages are the simple moving average (SMA) and the exponential moving average (EMA). Here’s a breakdown of each:
SMA
| Definition | SMA is a straightforward average of prices over a set number of time periods. That’s what we showed you in the example above. |
|---|---|
| Formula | Where P = the price of the asset, and n = the number of periods [SMA = (P1+P2+...+Pn)/n]. Note: Every new period, you add the most recent closing price and drop the oldest. |
| Pros | Easy to calculate; Easy to understand; Great for beginners |
| Cons | Doesn’t react quickly to sudden price changes; Can miss quick reversals or sudden breakouts |
EMA
| Definition | EMA is designed to be more responsive to recent price changes by giving more weight to the latest data points in a series. That way, the data is more responsive to fresher price points. |
|---|---|
| Formula | The EMA calculation is more involved, requiring an initial SMA and a “smoothing factor.” Initial SMA: Where P = the price of the asset, and n = the number of periods, [SMA = (P1+P2+...+Pn)/n]. Smoothing factor: Where s = the smoothing factor [s= 2/(selected time period + 1)]. EMA: Where P = the price of the asset, s = the smoothing factor, t = today, and y = yesterday, [EMAt = Pt x s + EMAy x (1-s)] |
| Pros | Quick and responsive to new trends |
| Cons | Sometimes leads to false signals in highly volatility; Less reliable in choppy markets |
Which moving average should you use?
Here’s a quick comparison of these two MAs to help you decide which one might be right for your trading style:
Feature | SMA | EMA |
|---|---|---|
| Calculation | Simple average of all prices in the period | Weighted average, giving more importance to recent prices |
| Responsiveness | Slower; Lags behind price action | Faster; Reacts more quickly to price changes |
| Best for | Long-term trend spotting; Identifying support and resistance levels | Short-term trend spotting; Capturing momentum |
| Weakness | Can be slow to signal a trend change | Can produce false signals in volatile markets |
How to calculate a moving average
We’ve given you the formulas. Now let’s try to do some math ourselves.
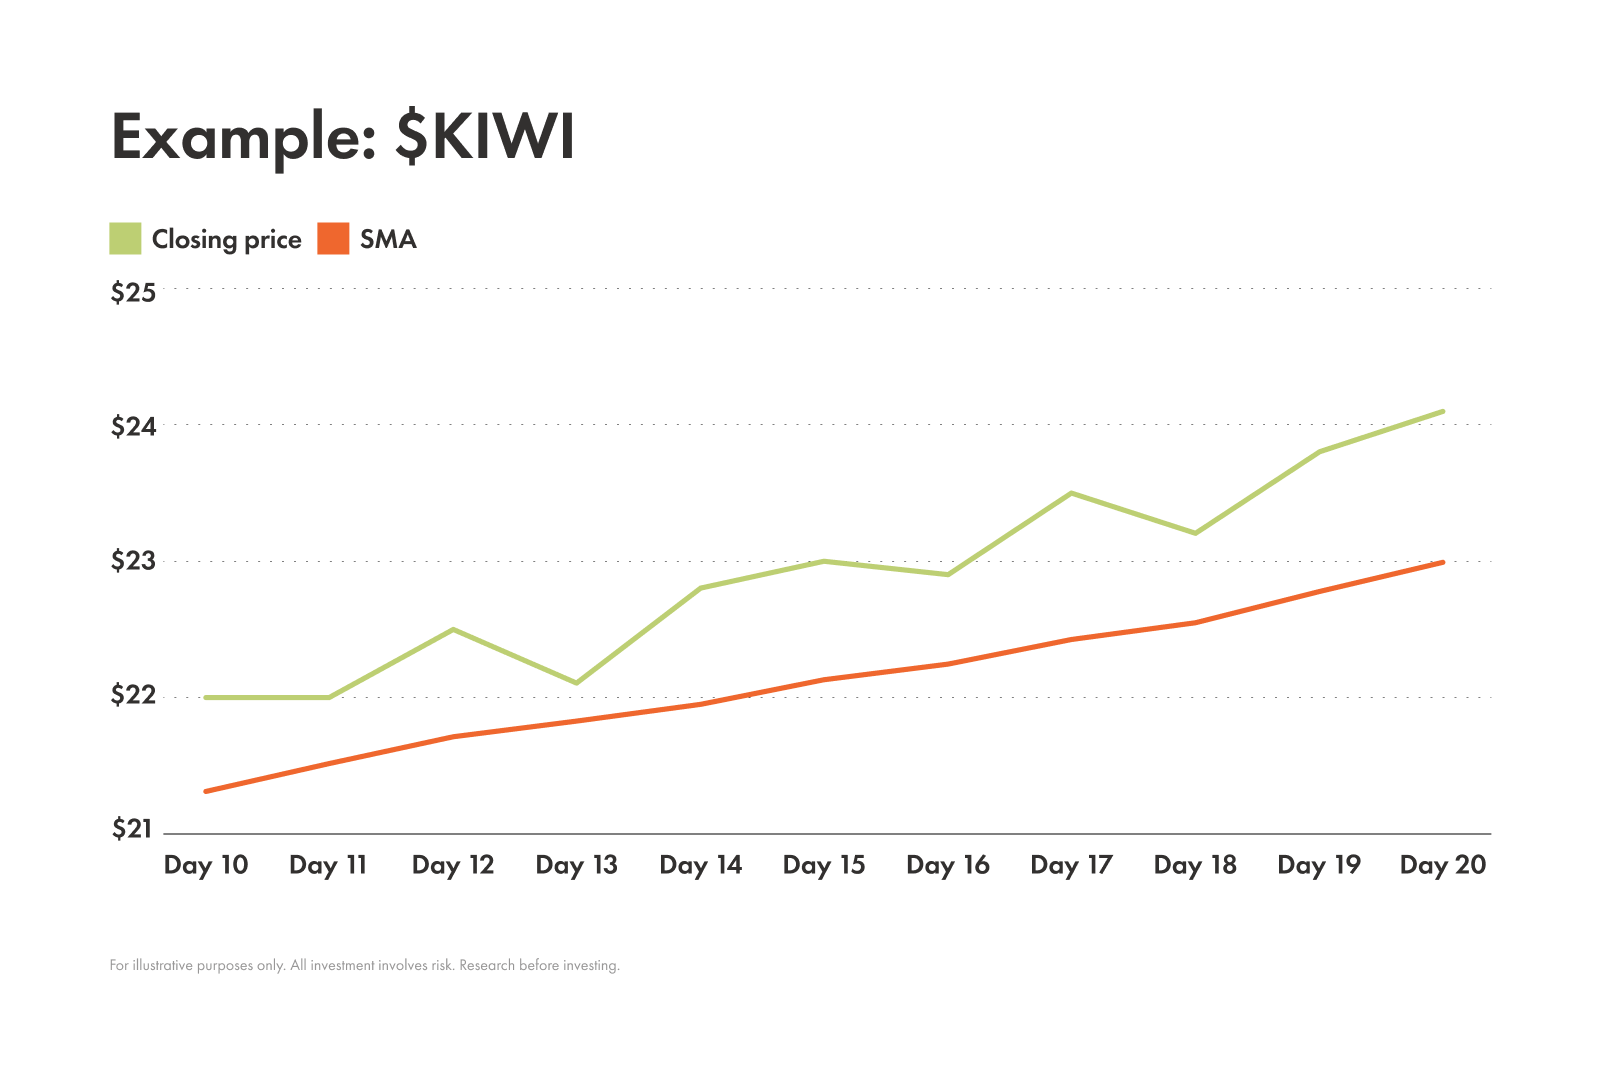
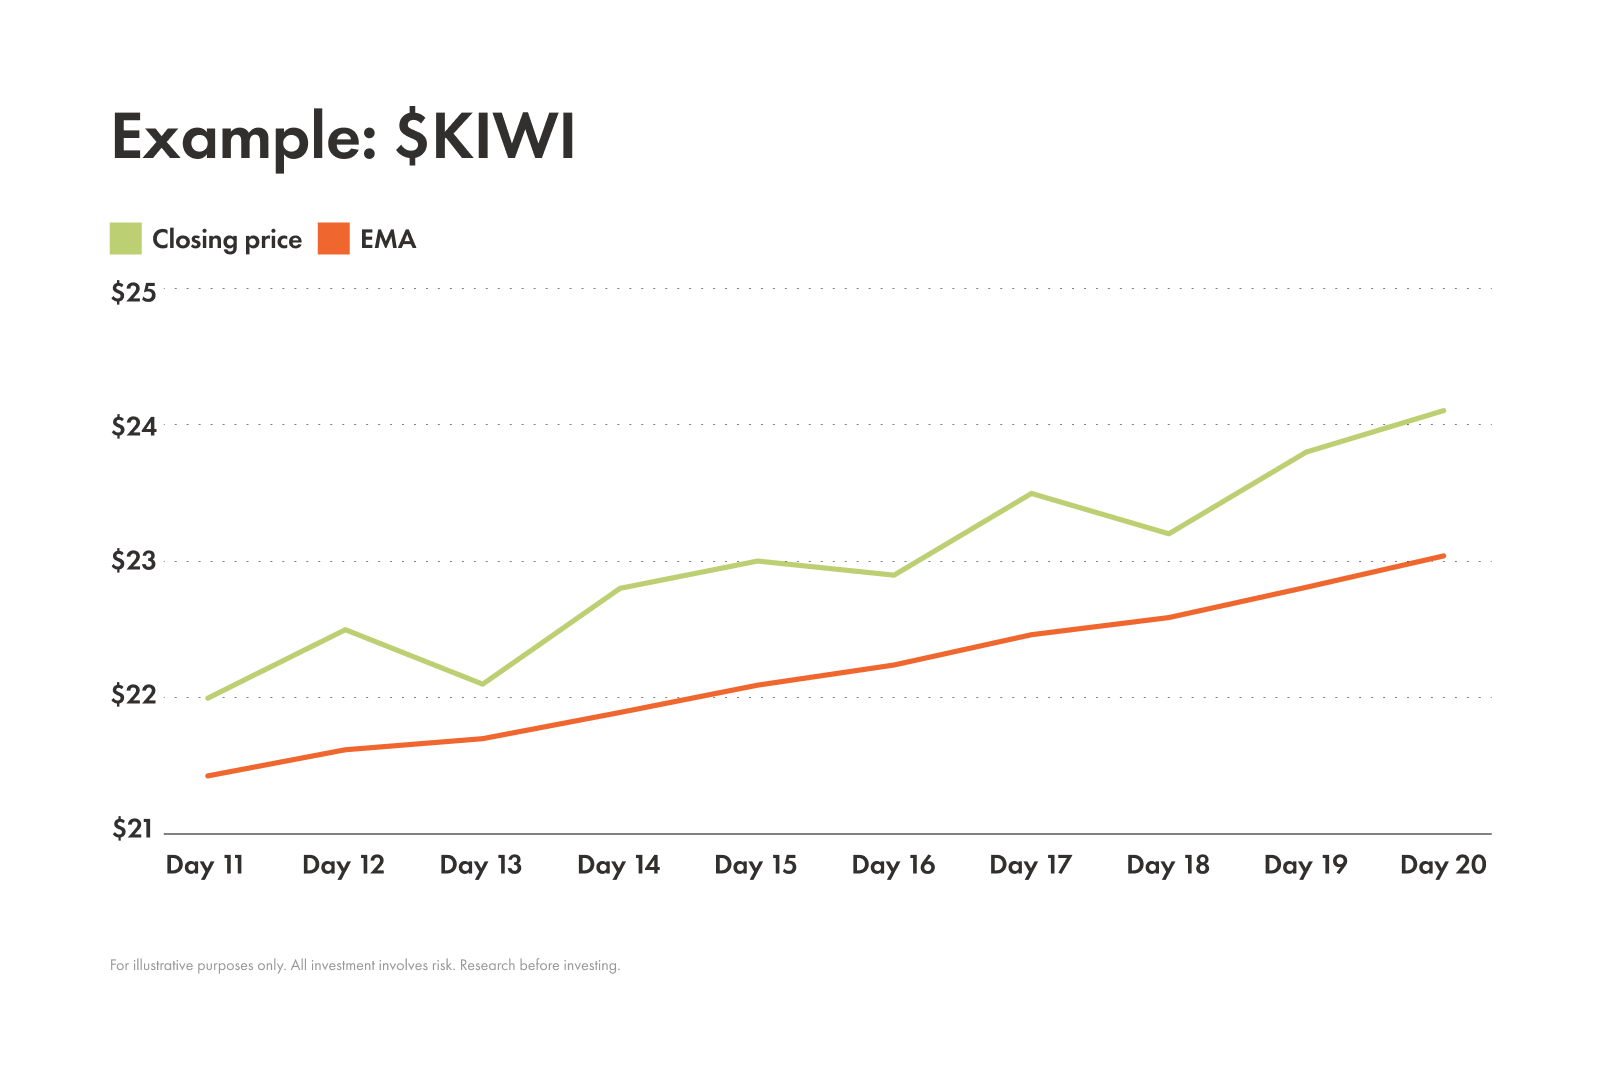
We’re going to calculate a 10-day SMA and EMA for a hypothetical stock called KIWI. Here are KIWI’s closing prices over the past 20 trading days:
Day | Closing price ($) | Day | Closing price ($) |
|---|---|---|---|
| 1 | 20.00 | 11 | 22.00 |
| 2 | 20.50 | 12 | 22.50 |
| 3 | 21.00 | 13 | 22.10 |
| 4 | 21.50 | 14 | 22.80 |
| 5 | 21.20 | 15 | 23.00 |
| 6 | 21.80 | 16 | 22.90 |
| 7 | 21.70 | 17 | 23.50 |
| 8 | 21.90 | 18 | 23.20 |
| 9 | 21.50 | 19 | 23.80 |
| 10 | 22.00 | 20 | 24.10 |
SMA calculation
Step 1: Since we’re calculating the 10-day SMA for KIWI, first identify the first ten days and put those prices into the formula.
SMA = (20.00+20.50+21.00+21.50+21.20+21.80+21.70+21.90+21.50+22.00)/10
Step 2: Next, add together the prices to get a sum of $213.10.
SMA = (213.10)/10
Step 3: Divide by the number of days (10) to get a 10-day SMA of $21.31
SMA = 21.31
So now you have the average for the first ten days. Now, for the moving part of the SMA, we can continue on through the data set for KIWI, adding the new price for day 11 and dropping the price from day 1. This will give us the 10 day SMA for day 11.
Day 11 SMA
Step 1: First we’ll input the prices from day 2 to day 11 into the formula and then the number of days we need to divide by (in this case 10).
SMA = (20.50+21.00+21.50+21.20+21.80+21.70+21.90+21.50+22.00+22.00)/10
Step 2: Next we’ll add together the prices to get a sum of $215.10
SMA = (215.10)/10
Step 3: Now we can divide by the number of days (10) to get the day 11 SMA of $21.51
SMA = 21.51
This continues on until you have a moving line of SMA data points from day 10 to day 20.
EMA calculation
Here’s how to begin calculating the 10-day EMA:
Step 1: We can use the SMA data above to help us so we don’t need to start from scratch with these equations.
Step 2: We have the smoothing factor equation we can use.
Where s = the smoothing factor,
s= 2/(selected time period + 1)
Step 3: We also have the EMA equation we can use.
Where P = the price of the asset, s = the smoothing factor, t = today, and y = yesterday,
EMAt = (Pt x s) + EMAy x (1-s)
Step 4: Since the 10-day EMA calculator requires the average of the day before the first day we can calculate the EMA for is day 11.
Day 11 EMA
Step 1: First we calculate the smoothing factor by inputting the selected time period for this average (in this case 10) into the equation. The resulting answer is .18.
s= 2/(10 + 1)
s= 2/11
s=.18
Step 2: Now that we have our smoothing factor, we can input the other values into the equation to complete the calculation.
Where P = the price of the asset, s = the smoothing factor, t = today, and y = yesterday,
EMAt = (Pt x s) + EMAy x (1-s)
EMAt = (22 x .18) + 21.31 x (1- .18)
EMAt = (3.96) + 21.31 x (.82)
EMAt = (3.96) + 17.47
EMAt = 21.43
Just like the SMA, the EMA is also a moving average, so you can continue to calculate the EMA from day 11 to day 20.
How to interpret moving averages
Now that you know how to calculate and plot MAs on a chart, you’re probably wondering what you can take away from these smoothed-out lines. You can learn a lot! An MA that:
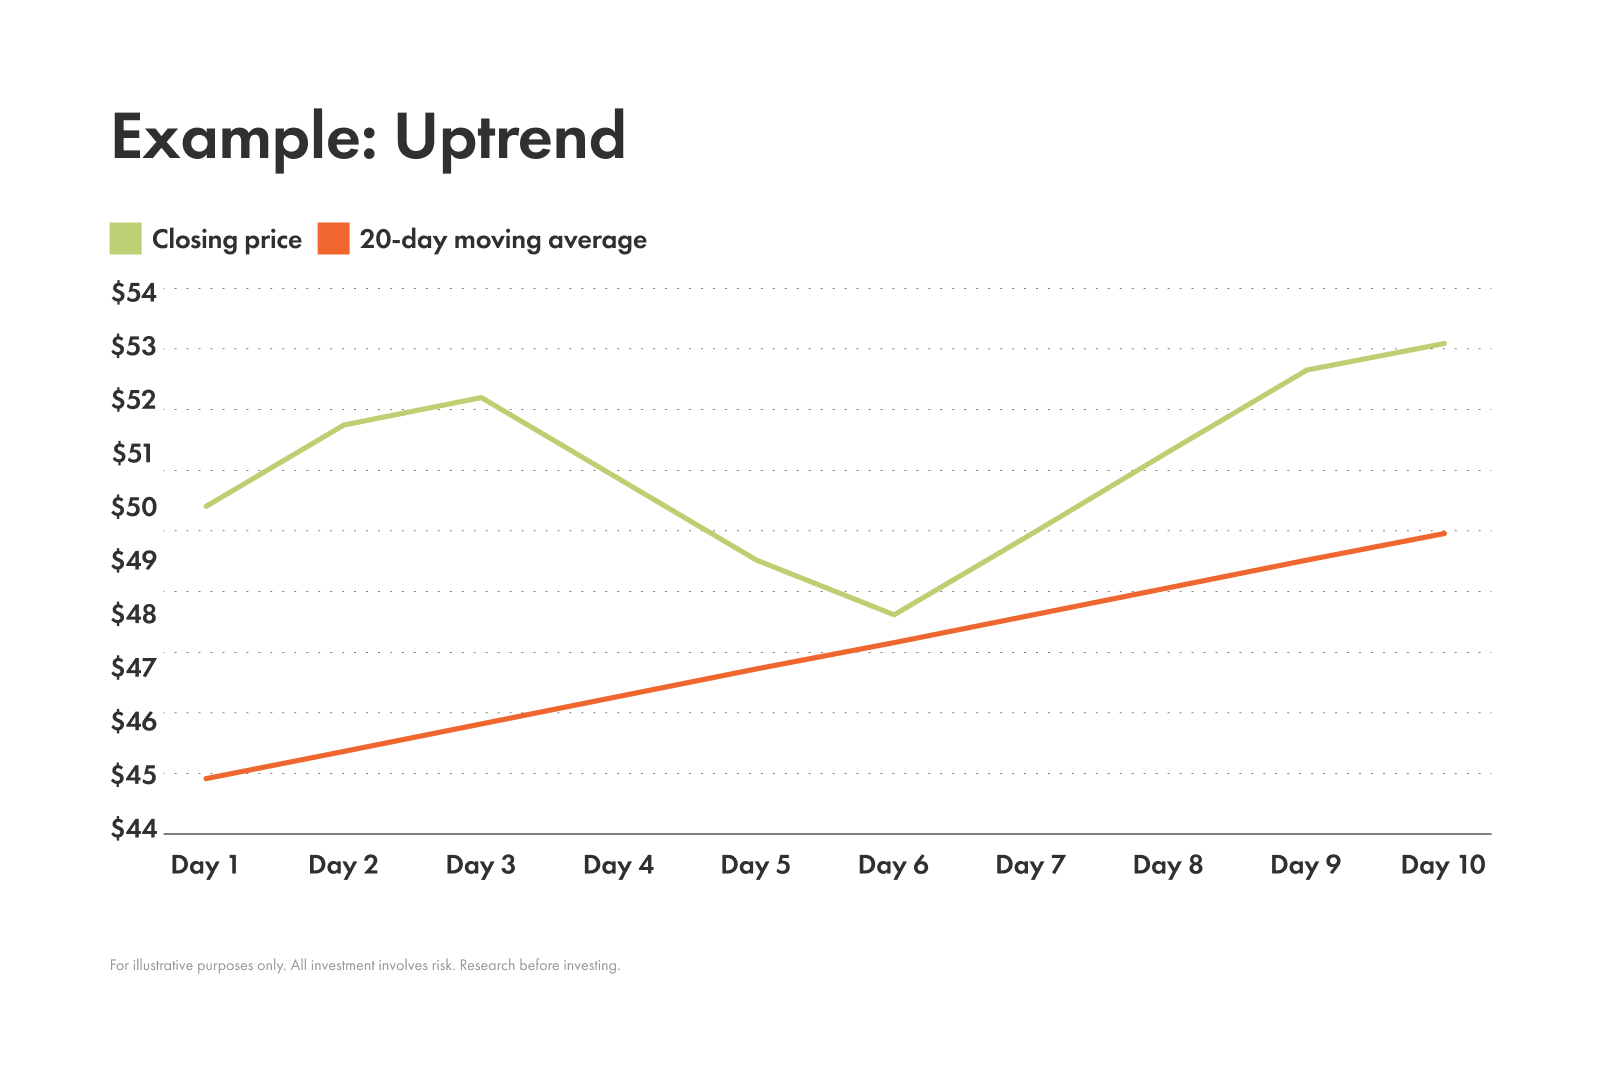
slopes up can signal an uptrend
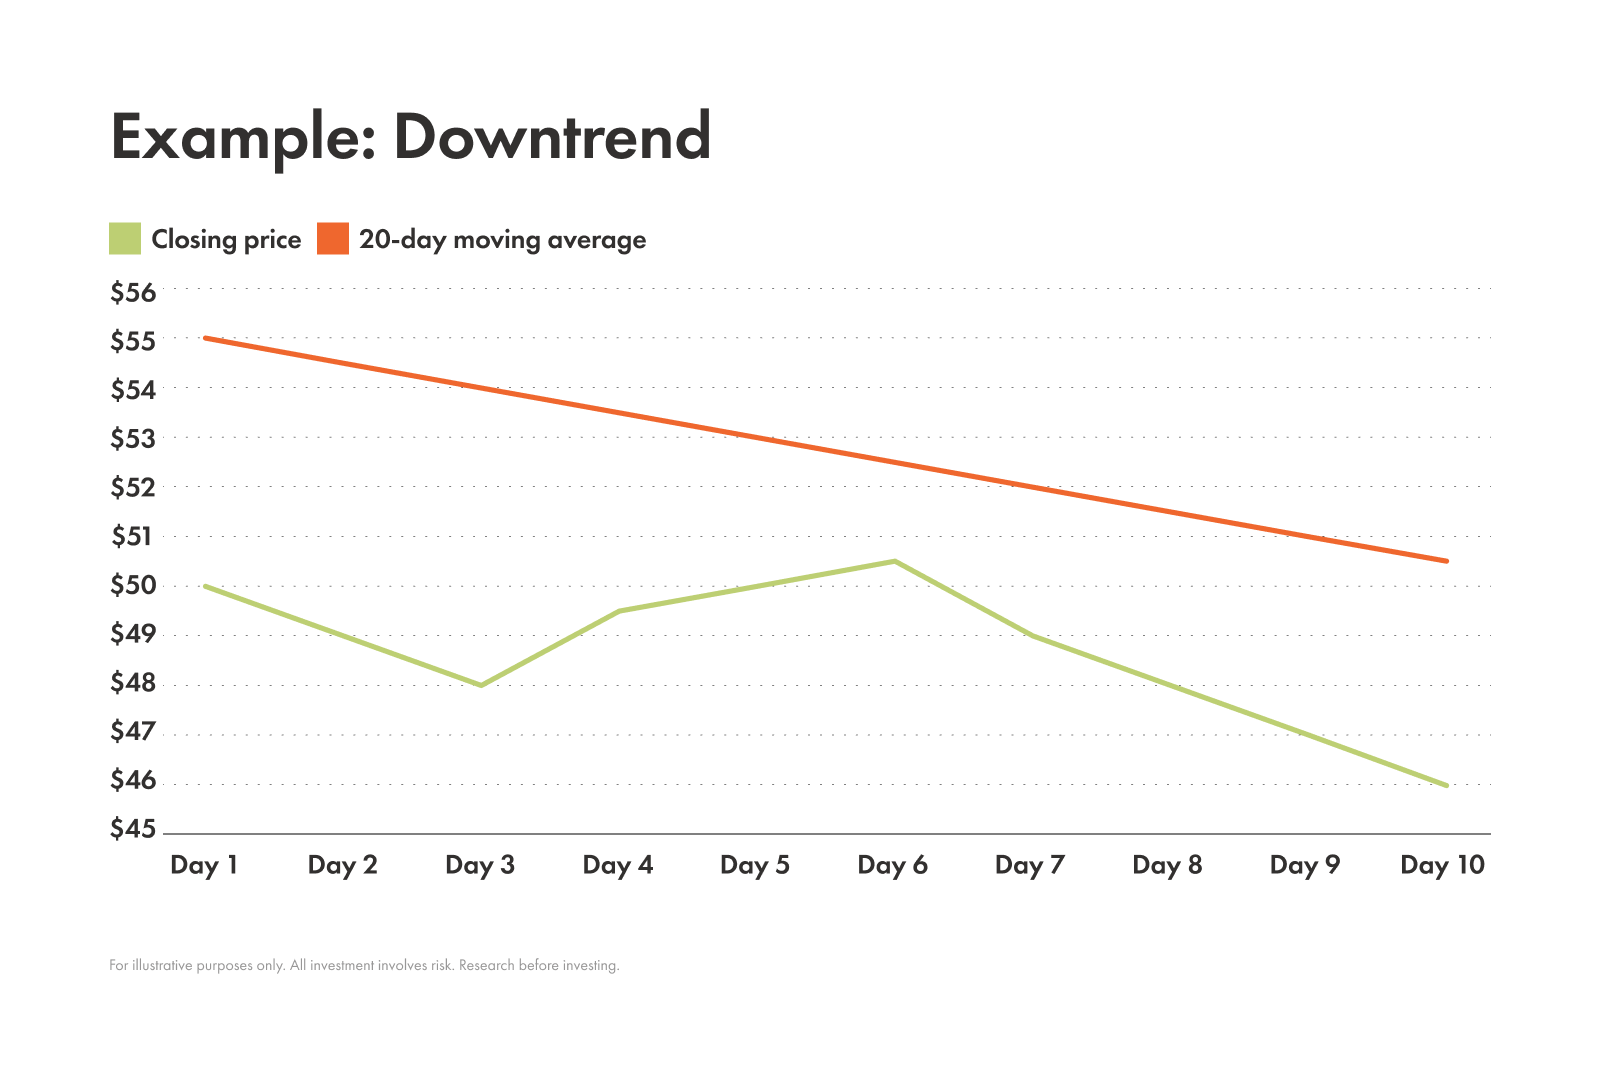
slopes down can signal a downtrend
remains flat can suggest a sideways market or consolidation
On top of direction, if you add other data to the chart, you can draw even more insights. One way of doing this is by tracking multiple moving averages at the same time, like:
SMA and EMA
MAs with varied timespans, like a long-term MA (commonly 200 days) and a short-term MA (commonly 50 days)
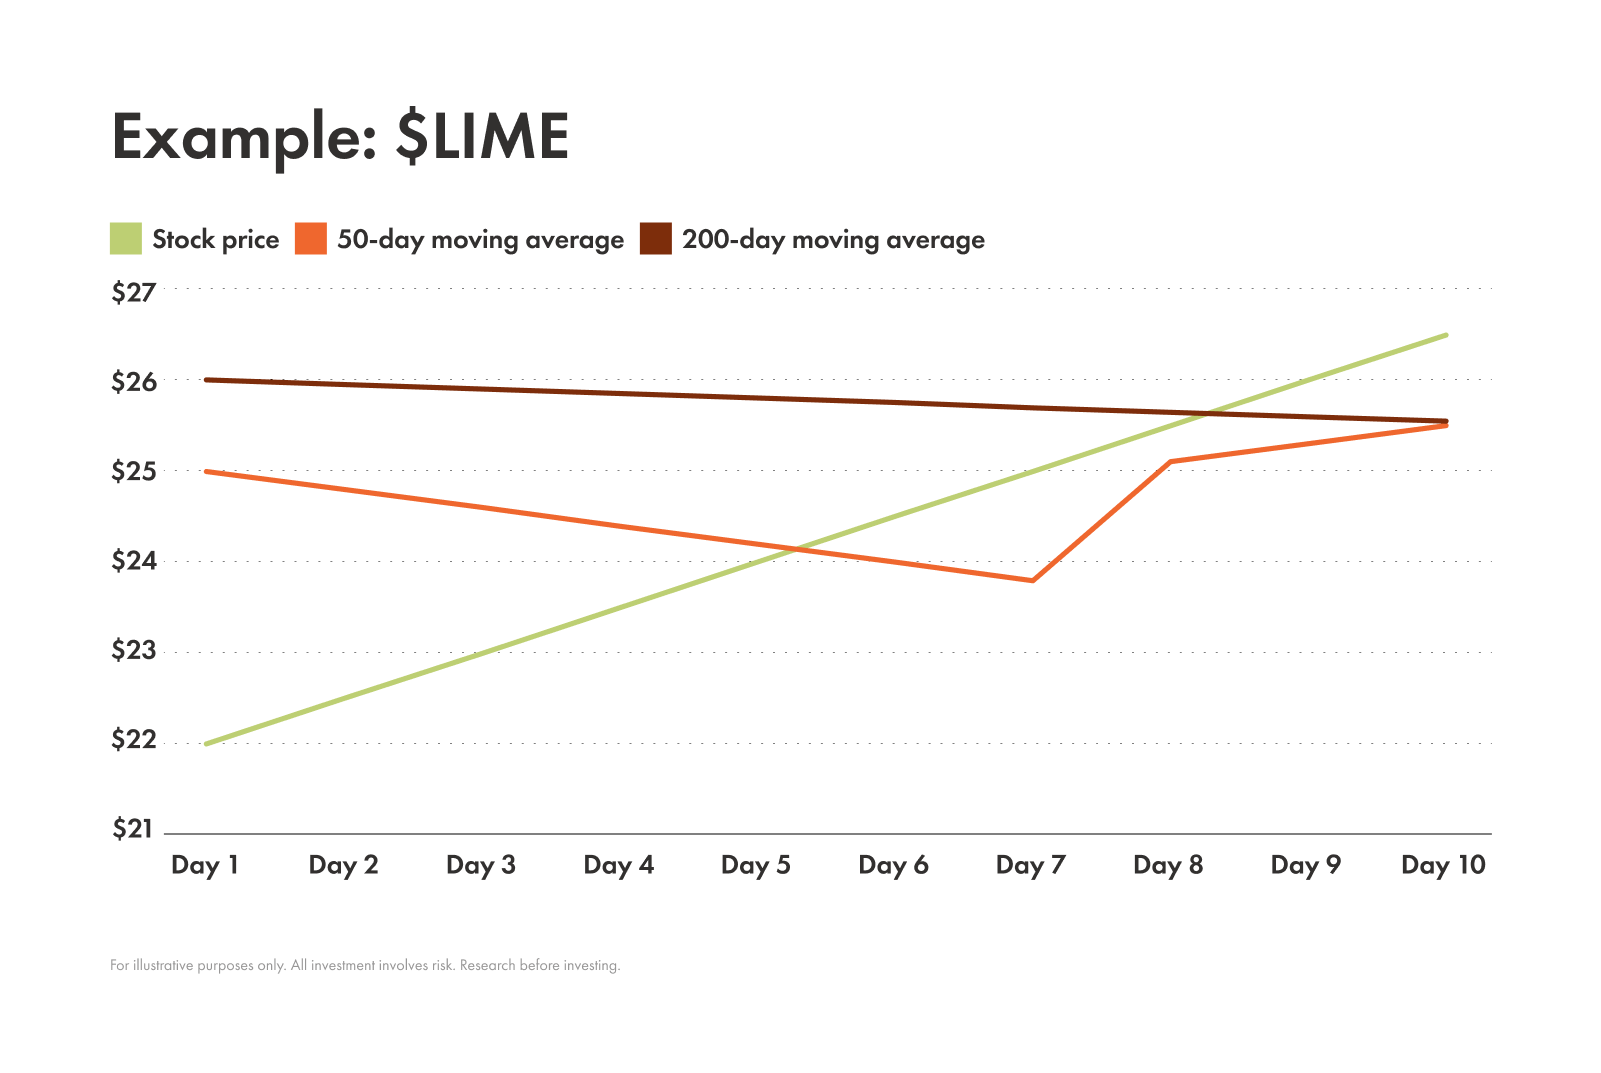
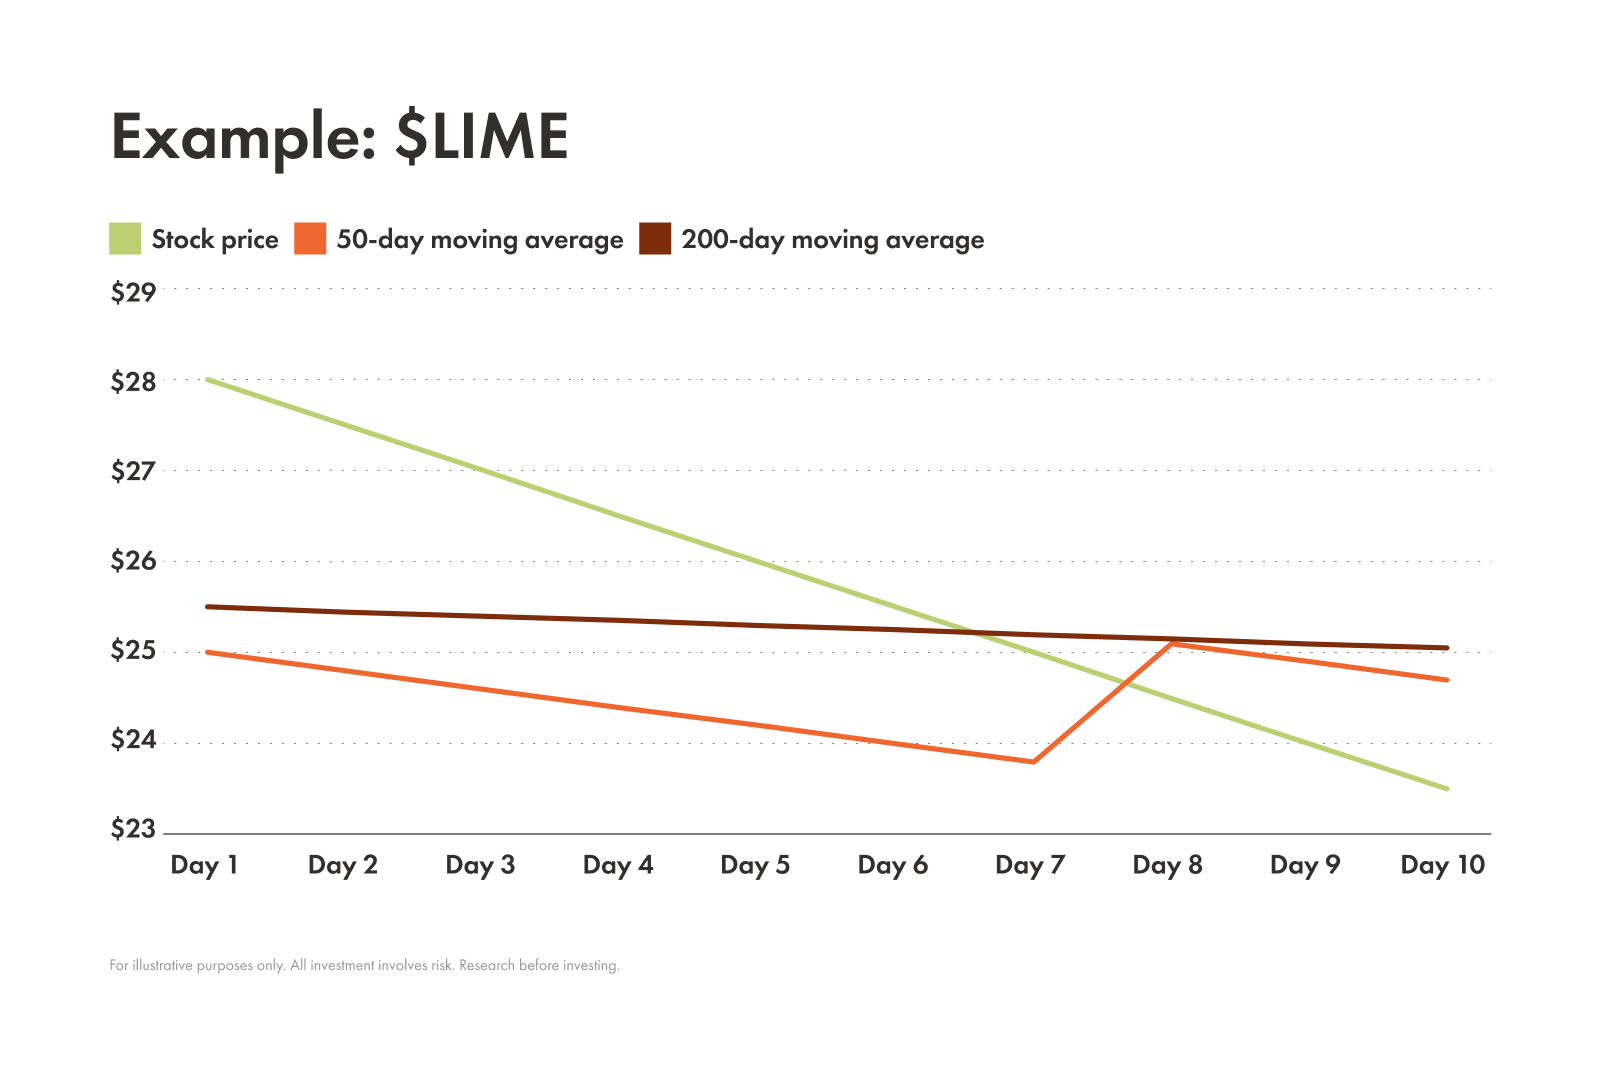
One of the most powerful signals of layered MAs is a crossover. This happens when two different MAs, or even the price itself, cross over each other. Here are some common crossovers and what they signal:
Price above MA
This crossover appears when the price of an asset crosses above its MA. This is generally a bullish signal and indicates an upward trend, because it suggests buying momentum is increasing and current price action is outpacing the historical average, potentially signaling a shift in market sentiment toward a more positive outlook.
Price below MA
Conversely, this crossover appears when the price of an asset crosses below its MA. This is generally seen as a bearish signal and indicates a downward trend, because it suggests selling pressure is intensifying and current price action is falling below the historical average, potentially signaling deteriorating market sentiment and waning buyer interest.
Golden cross
You’ve spotted a golden cross when a short-term MA crosses above a long-term MA of the same asset. This is seen as a very bullish crossover and indicates an upward trend.
Death cross
This is the opposite of a golden cross. A death cross appears when a short-term MA crosses below a long-term MA of the same asset. This is seen as a very bearish crossover and indicates a downward trend.
Moving averages as dynamic support and resistance
You don’t have to think of MAs as only trend identifiers. They can also be used as dynamic support and resistance levels.
MAs constantly change with the price of the asset, unlike static support and resistance (which are fixed price points).
For example, in a strong uptrend, the MA often acts as a floor. When the price dips down to the MA, it might bounce off it and continue its upward journey.
On the other hand, in a downtrend the MA can be a ceiling, rejecting the price as it tries to move higher. This can help you manage risk in your trade decisions since it can signal it might be challenging to break upwards.
Common timeframes traders use for this are the 20-day EMA, 50-day SMA, and 200-day SMA.
Popular moving average strategies
Now that we’ve covered the basics, it’s time for the exciting part — strategy!
There are some common strategies that traders use when working with MAs. These details can help you decide it they might work for you:
Single MA trend-following. This simple strategy uses just one moving average to define trade bias. For example, if the price is above the MA, you’re only looking for buy opportunities and if it’s below, you're only looking for sell opportunities.
MA crossovers. A classic MA strategy that involves a “fast” (shorter time period) and a “slow” (longer time period) moving average with the idea that you’ll enter a trade when the fast MA crosses the slow MA and signals a potential trend change.
Combining MAs with other indicators. MAs are often combined with other technical indicators like the relative strength index or moving average convergence divergence to confirm signals and increase confidence.
The limits of moving averages
While MAs can be an extremely useful tool for identifying potential opportunities they aren’t perfect. Before you incorporate a MA into your investing decisions it’s important to consider their limitations:
Lag. MAs are based on data from the past. They just show what has already happened and can sometimes be slow to incorporate new information. This is a problem to consider when trading in fast-moving markets.
Whipsaws. In a choppy market (where prices bounce up and down with no clear direction) MAs can give off lots of false signals, which can lead to a string of losing trades, or "whipsaws."
Overfitting. A MA period fine-tuned for one particular chart or past data may fail miserably when applied to another asset or when used for real-time trading.
Final tips for using moving averages
MAs are a powerful tool, but they're just one piece of the puzzle. To use them effectively, here are some final tips:
Choose wisely. When picking a MA type to use, consider how it aligns with your trading style. Are you a fast-paced day trader or a long-term investor?
Confirm with others. It’s always a good idea to use multiple analysis tools or indicators to confirm your ideas before making a move!
Practice makes perfect. Play around with different time periods and see how they work on different assets and at different volatility levels. What works in one instance might not work for another.