Like stocks, bonds are a way to connect institutions who need money with lenders who have it. Only instead of giving investors equity in the company like a stock does, bonds are simple loans. They earn regular interest payments until the end of a predetermined amount of time (when the bond "matures"), at which point the issuer pays back all the money it borrowed. This guide explains how bonds work, common types, and practical steps for adding them to your portfolio.
What bonds are and why they exist
A bond is a loan you make to a government or corporation in exchange for regular interest payments and the return of your principal at maturity. Instead of borrowing from a bank, these organizations raise money directly from investors like you.
When you buy a bond, you are lending your money to the issuer for a set period of time. In exchange, they promise to pay you regular interest, known as a coupon, and return your original money when the loan ends. Bonds exist because it is often more efficient for large entities to borrow from thousands of everyday investors than to take out a single large bank loan.
How bonds work
Investors can hold onto a bond, collecting interest and waiting for that final payment, or they can sell it to someone else. The amount of money they'll get depends on the bond's interest rate, the time left until it matures, and other factors.
The price of a bond is the present value of its future payments (remaining interest payments plus the face value).
In a portfolio, bonds typically act as a diversifier against stocks and other riskier assets. That's because bonds react differently to different economic environments. So in instances when stocks decline sharply, bonds can often buoy a portfolio by continuing to deliver a relatively safe return.
How to invest in bonds
Getting started with fixed-income investments does not have to be complicated. Here is a standard approach to adding them to your portfolio.
Determine your timeline: decide when you'll need the money. If you are saving for a house down payment in 2 years, you will want short-term investments. If you are balancing a retirement portfolio for 20 years down the road, you can look at longer timelines.
Choose your investment type: decide between individual bonds (which may require more capital and research) or diversified funds such as exchange-traded funds (ETFs) or mutual funds.
Open an account: use a brokerage account or a managed account. Consider using tax-advantaged accounts like a Tax-Free Savings Account (TFSA) or Registered Retirement Savings Plan (RRSP) to hold your investments.
Place an order: find the ticker (for a fund) or the bond issue, enter the amount, and submit your order.
Where to buy bonds in Canada
Canadians have a few standard options for purchasing these assets, depending on how hands-on they want to be:
Online brokerages: Buy bond ETFs or mutual funds the same way you would buy a stock. Some brokerages have fixed-income desks for individual bonds, though these often require high minimums.
Managed portfolios: Robo-advisors can automatically include a mix of fixed-income assets tailored to your risk tolerance.
Direct purchase: Buy certain government bonds directly through the Bank of Canada or provincial authorities, though this is less common today.
Bond terms you should know
The fixed-income world is full of jargon. Here are the standard terms you will encounter:
Face value: the initial amount of money the bond issuer borrows and promises to pay back.
Coupon rate: the annual interest rate paid on the face value. If a $1,000 bond has a 5% coupon, it pays $50 a year.
Maturity date: the exact day the issuer must return your original investment.
Yield: the effective return you get on a bond based on the price you paid for it, which might be higher or lower than the face value.
Duration: a measure of how sensitive a bond's price is to changes in interest rates. A longer duration means the price will fluctuate more when rates move.
How bond interest rates are set
There are many ways to invest and potentially earn a return. Stocks, bonds, alternative assets like private credit or real estate, or simply putting your cash in an interest-bearing account are all ways to generate a return. The size of that return all depends on one core principle: risk.
Think of it as hazard pay. Anyone selling an investment needs to convince you that giving them your money will be worthwhile in the end. The more likely you are to lose your money, the higher the reward needs to be.
Bonds need to offer enough interest to account for two risk factors:
Opportunity cost. Lenders may find more attractive options for their money.
Credit risk. The borrower may be unable or unwilling to pay back the loan.
These two factors determine the initial interest level on a bond. But when one or both change after the bond is issued (interest rates go up or down, or the lender's stability changes), since the interest rate is set, the value of the bond itself changes. If you lend money today and realise tomorrow that you could have gotten a better deal elsewhere, the value of the original deal drops.
How bond pricing works
The interest payments and face value of a bond are determined when it is issued. But if you want to buy or sell that bond before it matures, the market price changes constantly.
Bond prices and interest rates generally move in opposite directions. If market rates fall below your coupon rate, your bond's price tends to rise; if market rates rise above it, your bond's price tends to fall.
How risky bonds are
On the spectrum of risk and return, bonds tend to sit between cash (the short-term interest rate set by central banks) and stocks. Here's how different assets compare across economic conditions:
Asset | Approximate expected returns | Economic conditions it tends to do well in | Economic conditions it does not tend to do well in |
|---|---|---|---|
| Cash | 2% - 3% | High interest rates | Low interest rates |
| Bonds | 2% - 4% above cash | Low growth, low interest rates, recession | High growth, high interest rates, high inflation |
| Stocks | 6% - 10% above cash | High growth, low interest rates, economic boom | Low growth, high interest rates, recession |
| Private credit | 4% - 8% above cash | High growth, high interest rates, economic boom | Low growth, low interest rates, recession |
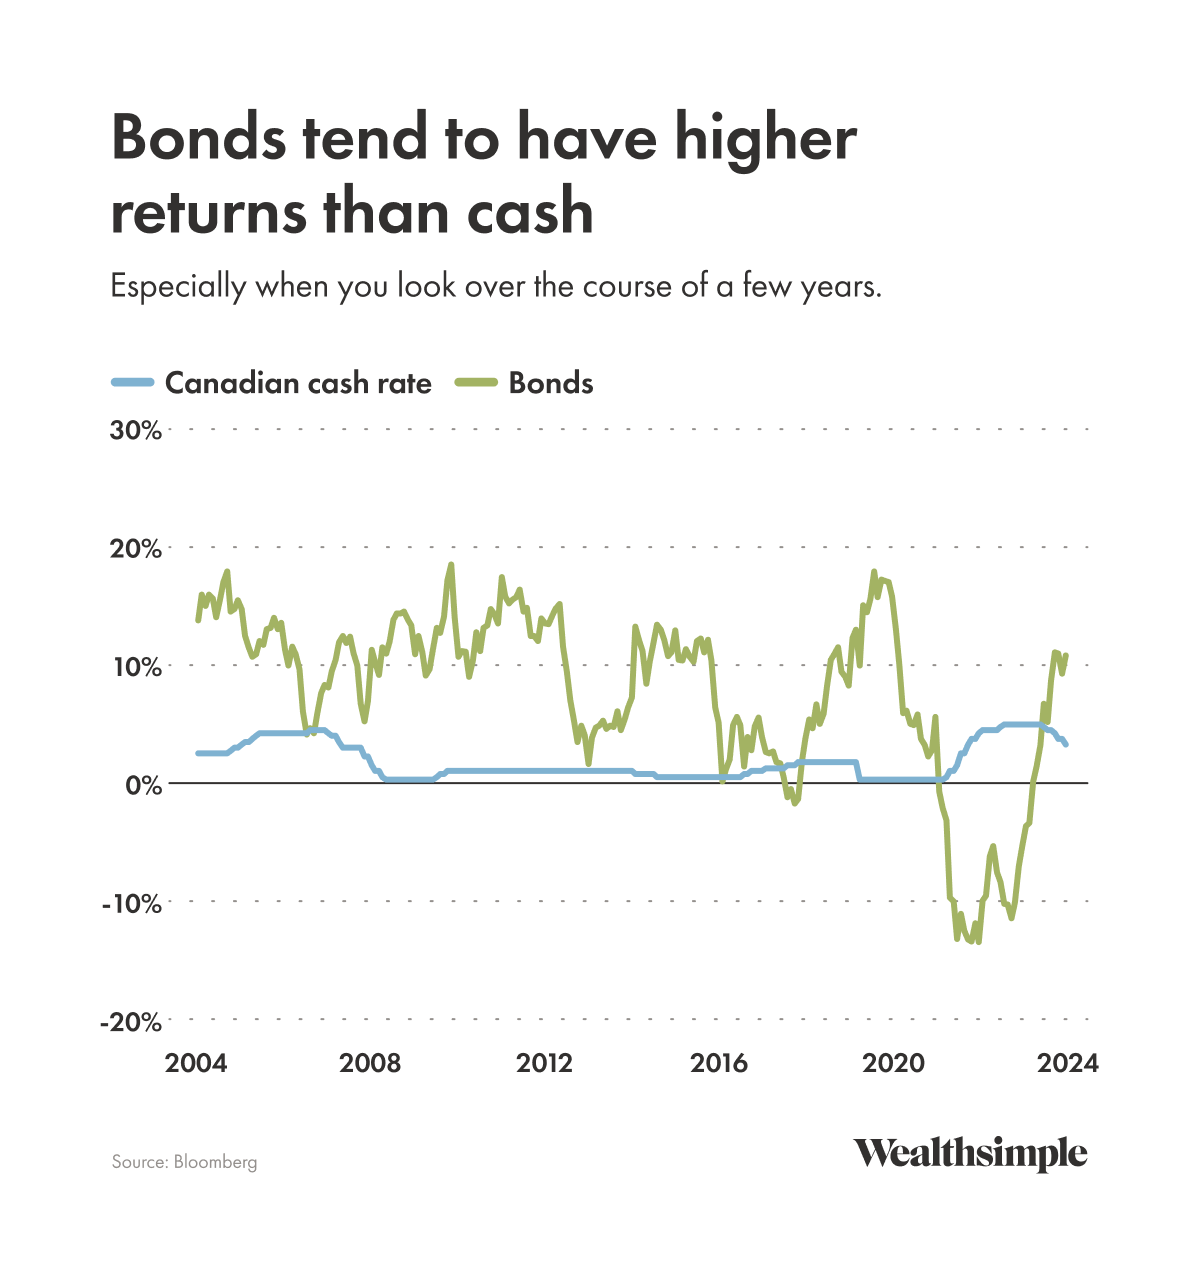
Bonds generally have a better chance of outperforming cash over the course of a few years. However, the past performance of any security or investment strategy is not an indicator of future performance, and past performance may not be repeated. Comparisons are for informational purposes and do not constitute investment advice. All investments involve risk.
Bond ratings and credit risk
Not all borrowers are equally reliable. To help investors understand the risk of losing their money, independent credit rating agencies assign grades to bond issuers.
These grades typically range from AAA (the highest quality, usually reserved for stable governments and large corporations) down to C or D (which indicates the issuer is in default). Bonds rated BBB or higher are considered investment grade, meaning they are relatively safe.
Anything rated BB or lower is considered high-yield, or junk. These lower-rated bonds must offer much higher interest rates to convince investors to take on the extra risk.
Types of bonds
There are all sorts of different bonds out there, each with their own issuers, duration, and risk level. Here are the main types you're most likely to encounter:
Government bonds
Whenever governments need to fund a large-scale project, like building a new highway (or a tunnel under a highway) they issue bonds. A lot of bonds.
Generally speaking, the richer or more politically stable the issuing country, the lower the bond yield. Remember that while government bonds are very low risk, they aren't totally guaranteed.
Government bonds have historically delivered returns in excess of cash. When they don't, they can still be very helpful as part of a portfolio, since they tend to diversify stocks when the economy struggles.
Corporate bonds
Large companies issue bonds to access capital markets, usually to fund projects or pay down debt. While they're usually much less risky than stocks, credit rating agencies consider corporate bonds to be on a tier below bonds issued by rich countries like Canada or the U.S. That extra risk tends to turn into higher yields.
Provincial and municipal bonds
National governments aren't the only ones who finance operations through bond sales. Provinces like Saskatchewan and Quebec, as well as major cities like Toronto, issue bonds with credit ratings similar to the Canadian or U.S. governments.
They perform closely to government bonds, but can earn a bit more in yield because provinces and cities aren't quite as financially self-sufficient as Ottawa: provinces don't have central banks, and Canadian cities aren't allowed to run deficits.
High-yield bonds
High-yield bonds are notably riskier than corporate or government debt. Their issuers tend to be companies who need cash more urgently and may have trouble securing traditional bank loans. To sweeten the deal to wary bondholders, these companies throw in higher yields to make up for the extra risk that comes with tying up your money with them.
Why investors care about bonds
Government bonds can offset stock volatility
In bad times, corporate earnings are usually weaker, so stocks aren't always a great bet. Though returns aren’t guaranteed, government bonds that have historically been lower-risk and may hold up better than equities in some downturns can come out on top. A small return is better than a loss, after all!
Corporate bonds, on the other hand, often decline during recessions because companies get tight on cash, which can result in missed bond payments.
Speaking of corporate bonds, they can be an economic indicator
When cracks start to show in economic performance, corporate bond prices tend to change faster than stocks. The credit spread between stable bond issuers (rich governments) and unstable ones (telegraph companies) usually widens, which suggests these bonds are riskier to hold.
If that happens, pay attention. Bonds can act as an early warning signal of economic issues. When credit spreads widen quickly, equity markets may react as well.
Bonds can stabilize a portfolio
Stocks are great growth assets for any portfolio, but there is a downside to going all stocks, no brakes. Eventually, you hit a wall. Portfolios with 60% stocks can actually perform better than an all-stock portfolio over a 5-year timeframe.
Bonds are one way to balance a portfolio. They don't typically bring in the same returns as stocks, but a portfolio with a healthy bond allotment could provide a cushion if the market takes a downturn.
How bonds tend to behave when interest rates are rising
Unlike stocks, which tend to slump during periods of high inflation, bonds usually thrive. When central banks raise interest rates, coupon payments on existing bonds stay the same, but new bonds are typically issued with higher yields. As a result, prices of existing bonds often fall.
If a company issues a bond with a 5% coupon on Monday and the Bank of Canada raises the overnight rate to 6% on Tuesday, that existing bond may be less attractive relative to new issues. The company might issue new 6% bonds on Wednesday to keep its bonds attractive...but the bonds it issued on Monday are still at 5%.
That means its yield tends to rise as the price falls (often discussed as "current yield"). For example, a bond paying $5 per year trades at $100 (5% current yield). If its price falls to $90, the same $5 payment equals about 5.6% current yield ($5 ÷ $90).
How bonds can help your portfolio
You can't guarantee any asset allocation will save you in bad times — markets are never certain. The easiest way to protect your portfolio is to diversify across a wide range of assets, but diversification isn't quite the same as reducing your risk.
Junk bonds can be relatively risky. Utility stocks are boring, but can be generally safe investments.
All of that said, holding bonds is one way to ensure your portfolio is less affected by severe market declines. The following charts simplify things a bit to take risk out of the picture, but show you how a good old-fashioned portfolio of 60% stocks and 40% bonds performed compared to an all-stocks-no-brakes portfolio in various moments of market turbulence.
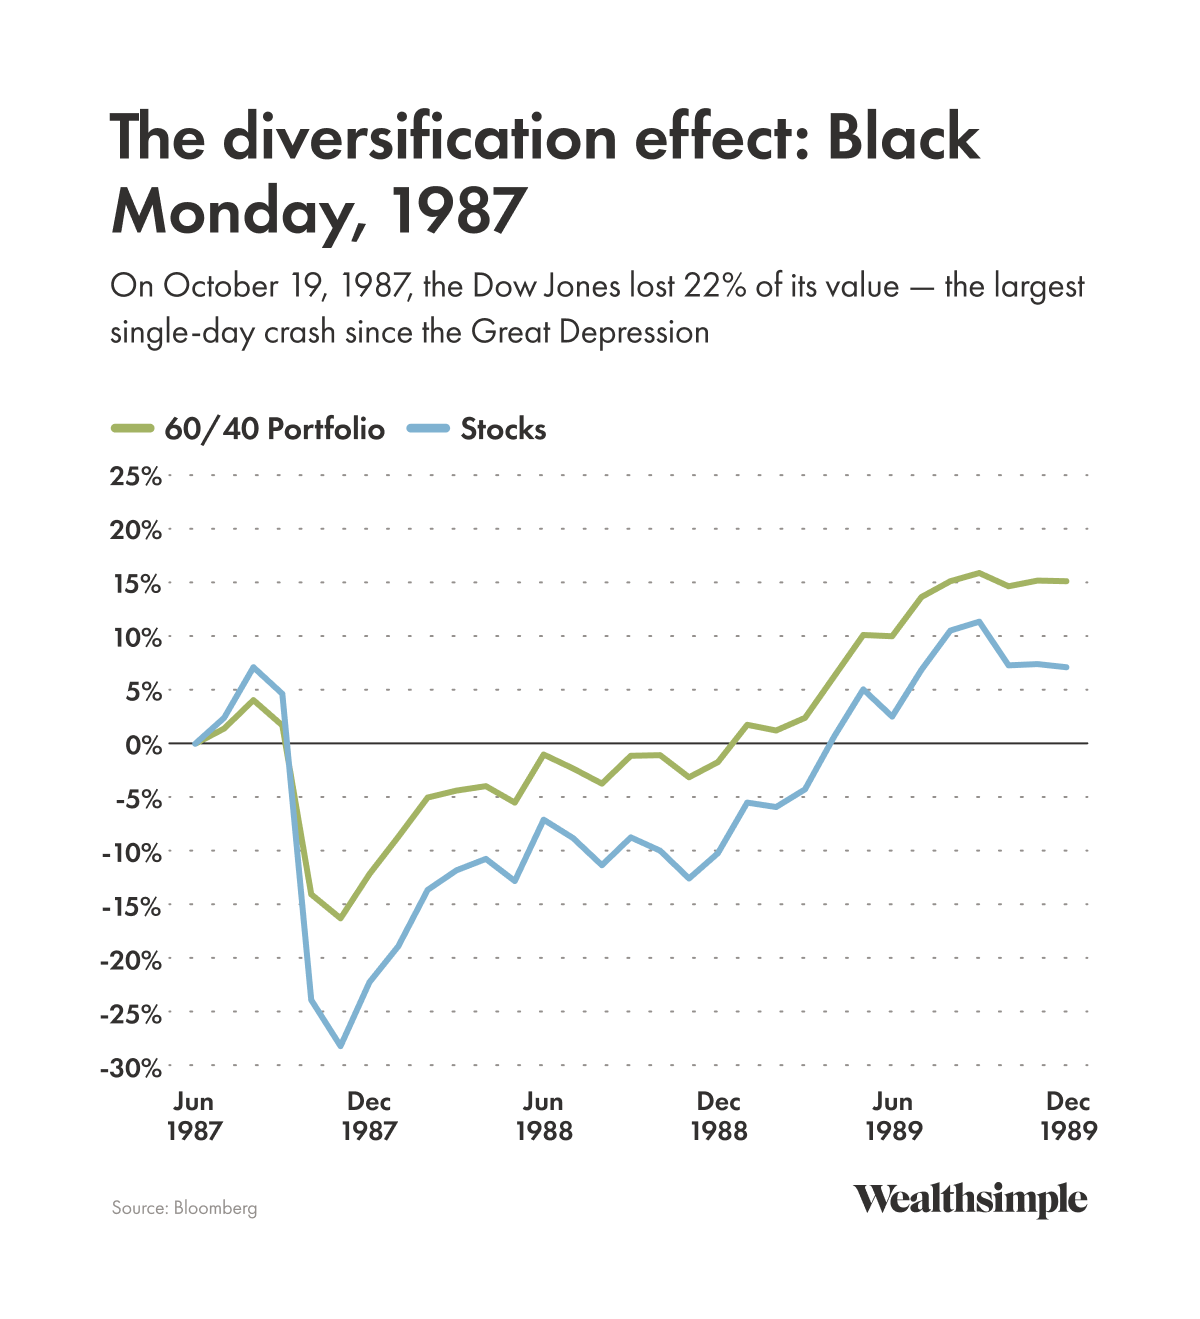
1987 - Black Monday
Without getting too far into the details, Black Monday was a bad day for investors. The Dow Jones lost 22% of its value in one day, the largest single-market crash since the Great Depression. As you can see, the 60/40 portfolio dropped 5% in the final months of 1987, but the all-stock portfolio fell much more sharply over the same period.
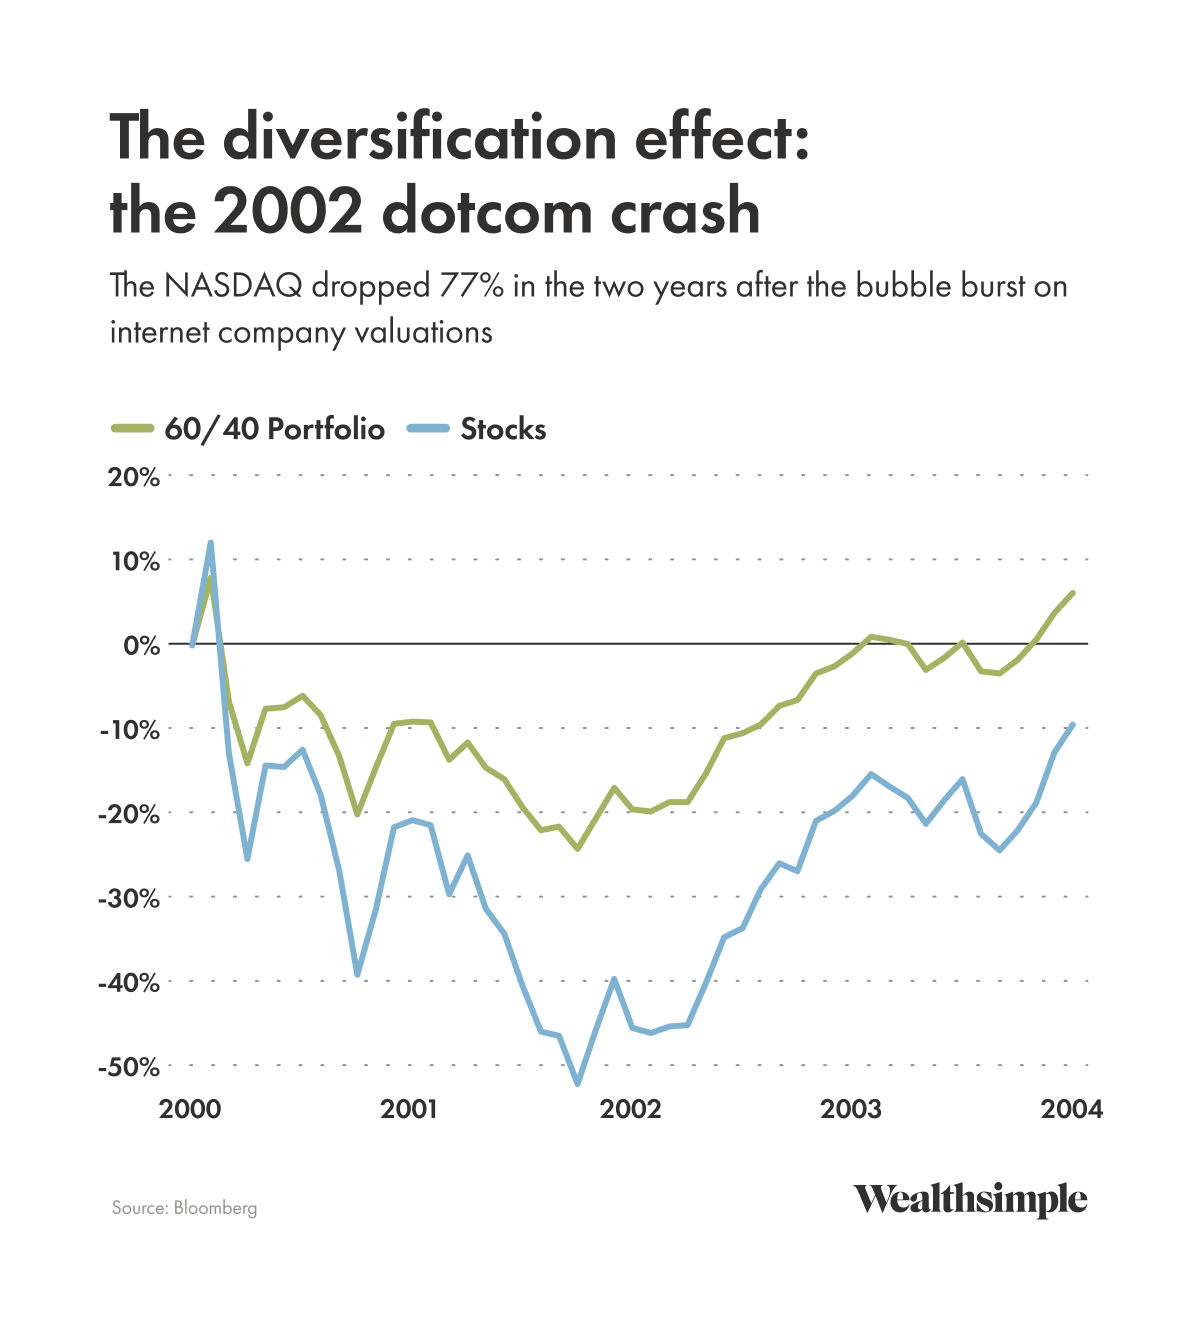
2000 - Dotcom crash
Another not-so-great time for stocks (or anyone in tech for that matter). Once upon a time, Wall Street thought .com addresses were money-printing machines. The resulting bubble reached its peak in 2000, then popped violently.
Trillions of dollars in valuation was wiped out over the following 2 years, with the National Association of Securities Dealers Automated Quotations (NASDAQ) plummeting 77%. No one's having a great time in the stock market, but the 60/40 portfolio is cruising along — it still declined, but by less than an all-stock portfolio.
The all-stock portfolio? Not so much.
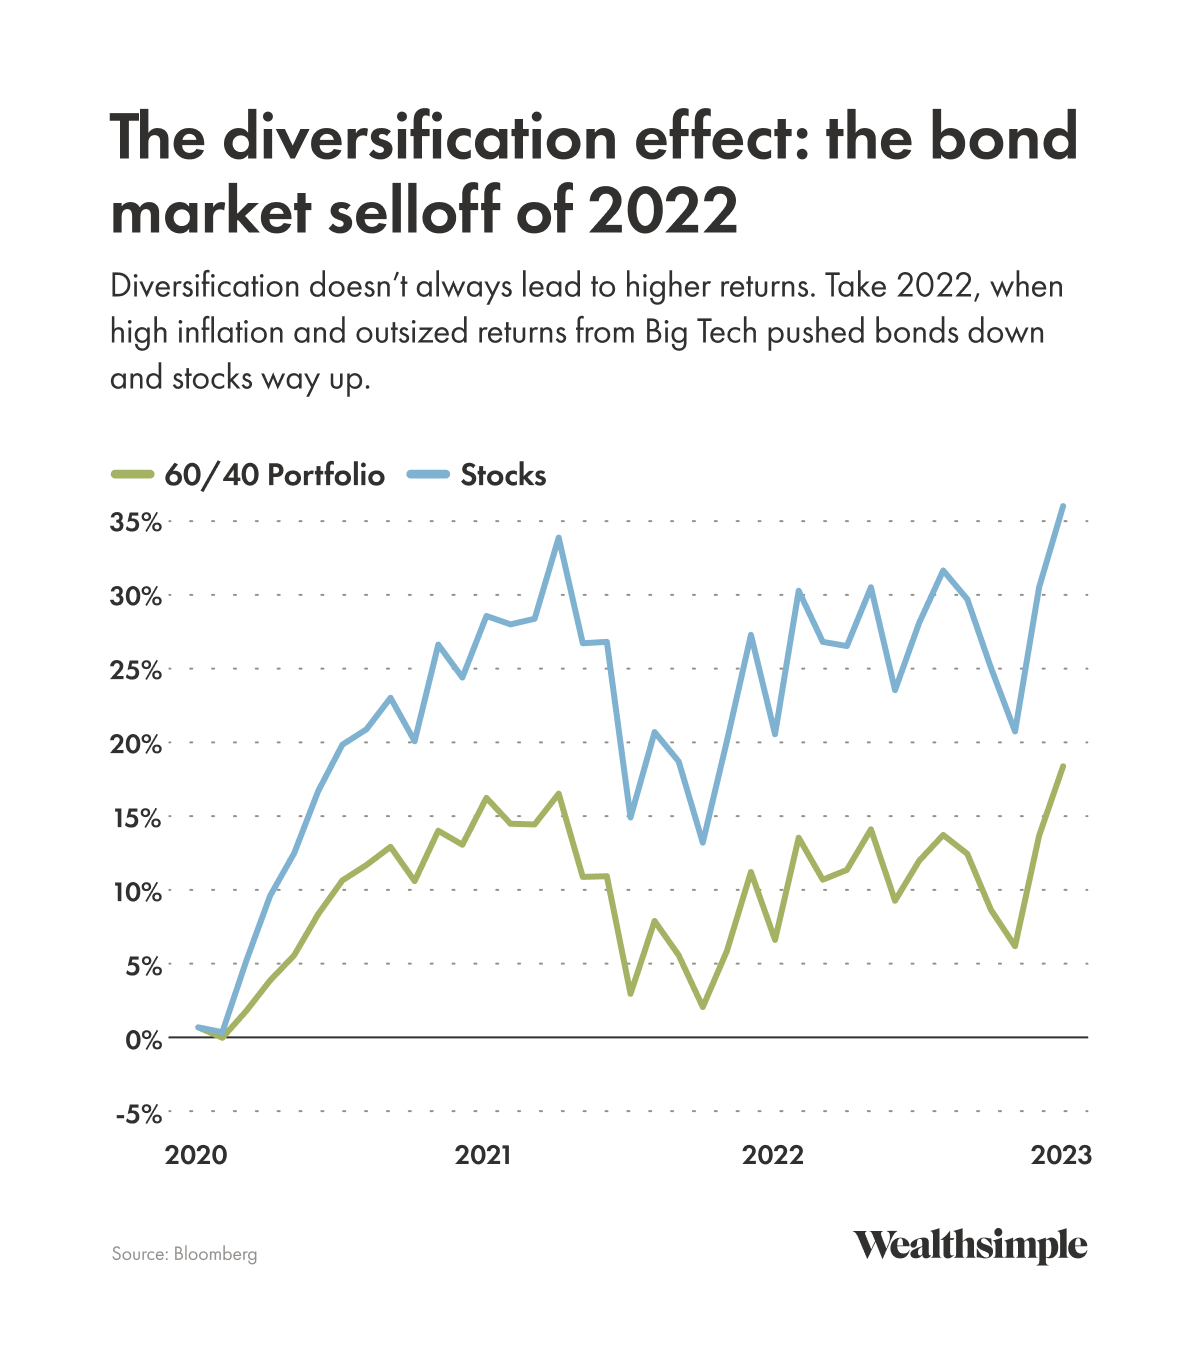
2022 - bond market selloff
Here's an interesting counterexample. U.S. stocks have been on an absolute tear since 2022 without any obvious signs of a serious crash ahead. Thanks to high inflation and outsize performance from seven U.S. tech companies (aka the Magnificent Seven), the 60/40 portfolio is motoring at a respectable speed, but with a healthy set of brakes should the market crash.
By comparison, an all-stock portfolio experienced larger swings in value.