Finance for Humans
Is the Stock Market Finally, Actually Overvalued?
Or: the problem with the price-to-earnings ratio
Wealthsimple makes powerful financial tools to help you grow and manage your money. Learn more
If you’ve followed markets at all over the past, oh, 15 years, you know there’s been a long-running debate about stock valuations — i.e., whether stocks are overpriced relative to corporate earnings. The debate has intensified since 2022, when AI optimism began launching stock prices to frothy new stratospheres. And yet despite doomers’ constant warnings that stocks are overvalued and the mother of all crashes is nighish, they just keep on climbing.
A new paper by economists at the Minneapolis Federal Reserve Bank argues that there’s a perfectly non-crazy explanation: while stocks look awfully expensive by one of Wall Street’s favourite metrics, one lesser-known indicator suggests that stocks are, in fact, priced pretty fairly. Or at least they were until recently. Let’s dive in.
The problem with the P/E ratio
Wall Street doomers often point to the price-to-earnings (P/E) ratio, a popular tool for measuring value, when arguing that stocks are expensive, not least because the S&P’s P/E ratio has been cruising well above its historical average of 17 for years now. But the Minnesota Fed’s core insight is that the P/E ratio is not as foolproof as advertised because it relies on GAAP earnings, an accounting metric that doesn’t subtract all the money firms plow back into factories and other equipment — which is money that never actually reaches shareholders.
From the 1950s to the 1980s, the U.S. (see chart below) and Canada were dominated by firms that poured mountains of cash into factories, computers, and other equipment, making their earnings look giant — and their P/E ratio nice and low — when in reality they were returning far less cash to investors than their P/E ratio implied.
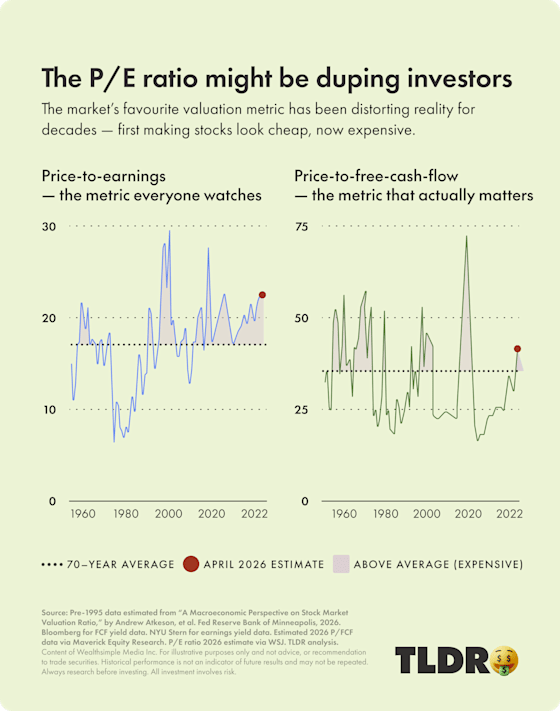
A far better tool to gauge value, the Fed paper argues, is price relative to free cash flow, or P/FCF, a metric that excludes all the cash companies spend on capital expenditures, like factories. “It’s a measure of everything that’s left at the end … to be paid to the owners [and investors] of the firm,” Jonathan Heathcote, one of the paper’s co-authors, said recently on Odd Lots.
P/FCF helps to explain why shares in today’s largest companies haven’t tanked, despite the S&P 500’s persistently high P/E: most big companies have offices full of well-paid white-collar workers, not giant factories to power and maintain. And their large payrolls make their P/E ratio appear high because worker wages, unlike capex spending, are a significant line item in corporate GAAP earnings. But today’s companies still haul in piles of cash for shareholders. Hence the S&P has stayed below its P/FCF historical average of 30 for much of the past decade — so maybe it’s not overvalued after all.
The AI twist in this valuation story
In recent years, tech giants have been investing fortunes into AI data centres and chips and pricey software engineers, burning through much of the cash that they would have returned to investors in years past. Which explains why the S&P’s P/FCF has finally shot north of its average. Does that mean a crash is coming? Not necessarily. Big tech’s AI investments could boost cash flows and make their stock prices look reasonable. It hasn’t happened yet, though, and the stakes keep rising.

Written By
Jared Sullivan
Jared Sullivan is an editor for Wealthsimple Magazine and author of the book "Valley So Low: One Lawyer's Fight for Justice in the Wake of America's Great Coal Catastrophe".